
June 29, 2026 a 09:16 am

Material Stocks - Performance Analysis
📊 The materials sector has shown diverse movements across various stocks within different time frames. Key players have demonstrated competitive performance scores indicating pivotal trends. In particular, short-term fluctuations are contrasted by longer-term recoveries and volatilities. This evaluation will focus on the performance of major stocks over one week, one month, and three months to provide a comprehensive overview of the materials sector.
Material Stocks Performance One Week
| Stock | Performance (%) | Performance |
|---|---|---|
| SHW | 8.32 | |
| ECL | 5.24 | |
| CTVA | 4.70 | |
| MLM | 1.08 | |
| LIN | 0.58 | |
| APD | -1.88 | |
| DD | -3.58 | |
| NEM | -5.56 | |
| FCX | -9.94 |
Material Stocks Performance One Month
| Stock | Performance (%) | Performance |
|---|---|---|
| SHW | 12.88 | |
| ECL | 10.52 | |
| MLM | 6.19 | |
| CTVA | 5.51 | |
| LIN | 4.43 | |
| APD | -0.20 | |
| FCX | -3.67 | |
| DD | -3.76 | |
| NEM | -12.15 |
Material Stocks Performance Three Months
| Stock | Performance (%) | Performance |
|---|---|---|
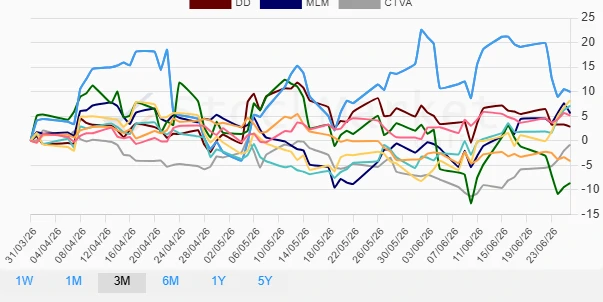
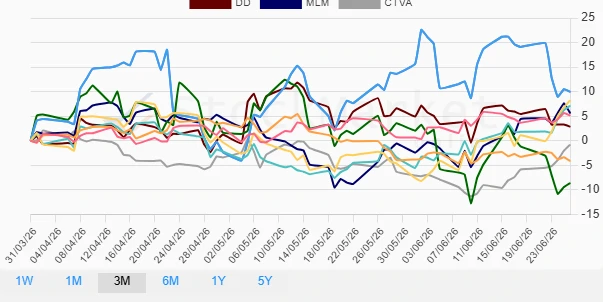
| FCX | 9.94 | |
| SHW | 8.25 | |
| ECL | 7.13 | |
| MLM | 5.61 | |
| LIN | 5.14 | |
| DD | 2.87 | |
| CTVA | -0.80 | |
| APD | -4.12 | |
| NEM | -8.61 |
Summary
✅ The materials sector has exhibited dynamic performance across different time periods. Notably, SHW has consistently shown strong performance across all timelines, showcasing its resilience. On the other hand, stocks like NEM and FCX have demonstrated volatility, scoring low in shorter-term perspectives but showing potential longer-term recovery. Investors should consider these trends when making decisions, noting that short-term volatility could provide opportunities for strategic entries and exits. Overall, diversification remains key in navigating the complex movements within the materials sector.
Smart Data Insight
Master the Perfect Entry & Exit for this Stock
Don't leave your profits to chance. Historically, this stock follows specific seasonal patterns that institutional traders use to maximize returns.
- ✅ Identify the "Golden Buying Window"
- ✅ Avoid high-risk correction cycles
- ✅ Backtested data from the last 20+ years