
September 28, 2026 a 09:16 am


📊 Material Stocks - Performance Analysis
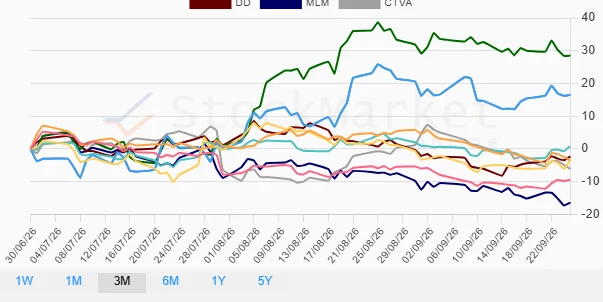
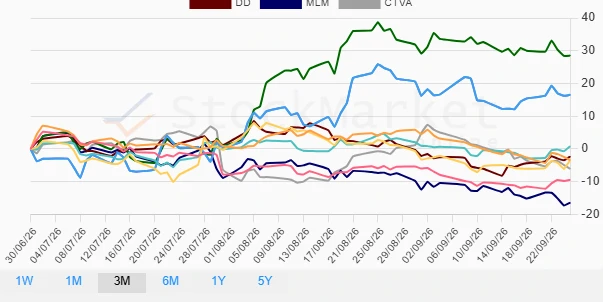
Material sector stocks have demonstrated variable performance across different time frames. Over the past week, select stocks have shown significant gains, while others have lagged considerably. The monthly outlook reveals a more bearish trend affecting most stocks, with the quarterly analysis showing some recovery mainly due to specific outperformers.
Performance Over One Week
The last week has seen mixed results in the materials sector, with notable top performers and underperformers. Ecolab Inc. (ECL) leads with a strong performance of 3.50%, while Martin Marietta Materials, Inc. (MLM) trails significantly with a decline of -3.09%. This week's performance highlights the potential volatility and rapid shifts within the sector.
| Stock | Performance (%) | Performance |
|---|---|---|
| ECL | 3.50% | |
| LIN | 2.68% | |
| SHW | 2.47% | |
| DD | 1.49% | |
| APD | 0.88% | |
| FCX | 0.28% | |
| CTVA | -0.73% | |
| NEM | -1.21% | |
| MLM | -3.09% |
Performance Over One Month
In a significant bearish trend, nearly all material sector stocks recorded losses over the last month. Martin Marietta Materials, Inc. (MLM) was the largest decliner with an 8.97% drop, reflecting broader economic pressures. The sector appears to be under cumulative stress from market fluctuations and external factors.
| Stock | Performance (%) | Performance |
|---|---|---|
| LIN | -4.04% | |
| SHW | -4.48% | |
| NEM | -4.85% | |
| FCX | -4.93% | |
| DD | -3.75% | |
| CTVA | -6.38% | |
| ECL | -2.46% | |
| APD | -8.80% | |
| MLM | -8.97% |
Performance Over Three Months
The quarterly performance of material stocks indicates a partial recovery, marked by Freeport-McMoRan Inc. (FCX) and Newmont Corporation (NEM) showing substantial gains at 16.56% and 28.52% respectively. These shifts highlight selective resilience to market challenges, contrasting broader trends seen in the monthly analysis.
| Stock | Performance (%) | Performance |
|---|---|---|
| NEM | 28.52% | |
| FCX | 16.56% | |
| ECL | 0.80% | |
| APD | -3.40% | |
| SHW | -3.38% | |
| DD | -2.31% | |
| CTVA | -6.07% | |
| LIN | -9.45% | |
| MLM | -16.41% |
Summary
⚠️ Over the last quarter, material stocks have shown clear volatility with varying performances across different time frames. While short-term fluctuations highlight the sector's dynamic nature, long-term resilience is evident in several stocks demonstrating robust recoveries. The analysis indicates cautious optimism, with potential opportunities for investors willing to navigate the inherent volatility.
Smart Data Insight
Master the Perfect Entry & Exit for this Stock
Don't leave your profits to chance. Historically, this stock follows specific seasonal patterns that institutional traders use to maximize returns.
- ✅ Identify the "Golden Buying Window"
- ✅ Avoid high-risk correction cycles
- ✅ Backtested data from the last 20+ years