October 27, 2025 a 09:17 am


Material Stocks - Performance Analysis
The materials sector has shown a varying degree of performance across different time frames. Over the past three months, specific stocks have demonstrated resilience amidst market fluctuations. In this analysis, we prioritize top-performing and underperforming stocks to reveal trends and potential future movements.
📊 Material Stocks Performance One Week
| Stock | Performance (%) | Performance |
|---|---|---|
| CTVA | 2.69 | |
| SHW | 0.86 | |
| APD | 0.28 | |
| DD | 0.11 | |
| MLM | -0.93 | |
| ECL | -1.06 | |
| LIN | -1.24 | |
| FCX | -1.93 | |
| NEM | -12.28 |
📊 Material Stocks Performance One Month
| Stock | Performance (%) | Performance |
|---|---|---|
| FCX | 15.38 | |
| DD | 6.55 | |
| ECL | 2.42 | |
| MLM | 1.39 | |
| NEM | -0.69 | |
| SHW | -2.23 | |
| APD | -4.40 | |
| CTVA | -6.06 | |
| LIN | -6.08 |
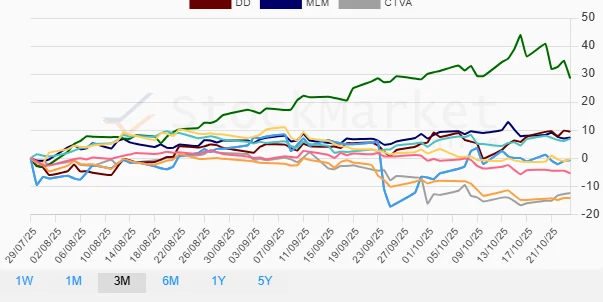
📊 Material Stocks Performance Three Months
| Stock | Performance (%) | Performance |
|---|---|---|
| NEM | 28.54 | |
| DD | 9.52 | |
| MLM | 7.39 | |
| ECL | 6.99 | |
| SHW | -0.33 | |
| FCX | -0.66 | |
| LIN | -5.32 | |
| CTVA | -12.41 | |
| APD | -14.15 |
✅ Summary
The materials sector shows diverse performance over different timeframes. The one-week analysis highlights CTVA's short-term lead and NEM's significant drop. Long-term, NEM stands out with a remarkable three-month surge, while APD and CTVA face challenges. The sector's fluctuation emphasizes the mixed sentiment among market participants and the importance of precise stock selection for future investments.
Smart Data Insight
Master the Perfect Entry & Exit for this Stock
Don't leave your profits to chance. Historically, this stock follows specific seasonal patterns that institutional traders use to maximize returns.
- ✅ Identify the "Golden Buying Window"
- ✅ Avoid high-risk correction cycles
- ✅ Backtested data from the last 20+ years