
July 27, 2026 a 09:16 am

📊 Material Stocks - Performance Analysis
In this comprehensive analysis, we delve into the performance dynamics of leading stocks in the materials sector over varying time horizons. Particular attention is paid to both the outperformers and underperformers, offering insights into the market trends shaping the sector. This allows investors to identify potential opportunities and risks within their portfolios. 📈📉
Material Stocks Performance One Week
During the past week, the materials sector exhibited a positive momentum overall, driven by notable performers such as FCX and NEM. While stocks like SHW underperformed, the general trend indicates a strong short-term rally in this sector.
| Stock | Performance (%) | Performance |
|---|---|---|
| FCX | 6.58 | |
| NEM | 4.51 | |
| CTVA | 2.82 | |
| DD | 1.47 | |
| MLM | 1.11 | |
| ECL | 0.08 | |
| APD | 0.44 | |
| LIN | 0.07 | |
| SHW | -1.82 |
Material Stocks Performance One Month
In the one-month horizon, the performance within the materials sector is mixed, with CTVA leading the charge and SHW facing significant declines. This period underscores the volatility and sector-specific fluctuations impacting investor sentiment. ⚠️❌
| Stock | Performance (%) | Performance |
|---|---|---|
| CTVA | 7.91 | |
| APD | 7.56 | |
| FCX | 1.07 | |
| DD | 0.49 | |
| NEM | -2.61 | |
| LIN | -1.24 | |
| ECL | -5.23 | |
| MLM | -9.17 | |
| SHW | -7.77 |
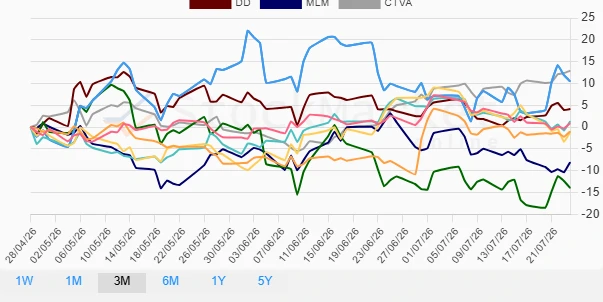
Material Stocks Performance Three Months
Over the three-month period, CTVA and FCX show robust growth, while NEM continues to decline steeply. The divergence in performance could signal underlying sector realignments or company-specific developments. 📈🔍
| Stock | Performance (%) | Performance |
|---|---|---|
| CTVA | 12.91 | |
| FCX | 10.48 | |
| DD | 4.14 | |
| ECL | 1.35 | |
| LIN | 0.88 | |
| APD | -0.98 | |
| SHW | -1.14 | |
| MLM | -8.03 | |
| NEM | -13.95 |
Summary
✅ Overall, the materials sector showcases a diverse performance landscape. Stocks like CTVA and FCX highlight potential opportunities with consistent growth across multiple time frames, while others like NEM face challenges requiring deeper scrutiny. Investors should consider these dynamics in their strategic allocation to enhance returns and mitigate risks.💡
Smart Data Insight
Master the Perfect Entry & Exit for this Stock
Don't leave your profits to chance. Historically, this stock follows specific seasonal patterns that institutional traders use to maximize returns.
- ✅ Identify the "Golden Buying Window"
- ✅ Avoid high-risk correction cycles
- ✅ Backtested data from the last 20+ years