
October 26, 2026 a 09:16 am


Material Stocks - Performance Analysis
The materials sector has shown a wide array of performance outcomes over various periods, reflecting the volatility and economic forces impacting these stocks. In the short term, diverse trends emerge, while mid to long-term data reveals impactful shifts. This analysis scrutinizes the performance metrics over one week, one month, and three months, providing insights into the most dynamic and static stocks within the sector.
Material Stocks Performance One Week 📊
The materials sector experienced mixed results over the past week, with DD leading the performance with a 5.48% increase. In contrast, NEM saw the most significant decrease at -7.91%. This short timeframe highlights the high volatility in the sector.
| Stock | Performance (%) | Performance |
|---|---|---|
| DD | 5.48 | |
| APD | 2.84 | |
| SHW | 1.70 | |
| MLM | 1.13 | |
| LIN | 1.09 | |
| ECL | 0.93 | |
| CTVA | -1.51 | |
| FCX | -6.57 | |
| NEM | -7.91 |
Material Stocks Performance One Month 📊
Over the last month, APD led the sector with a robust 8.76% increase, while NEM experienced the largest decline at -10.41%. The data here offers insight into emerging trends and shifts in market confidence.
| Stock | Performance (%) | Performance |
|---|---|---|
| APD | 8.76 | |
| LIN | 8.07 | |
| MLM | 4.84 | |
| DD | 3.78 | |
| ECL | 3.29 | |
| SHW | 2.61 | |
| CTVA | -0.71 | |
| FCX | -9.92 | |
| NEM | -10.41 |
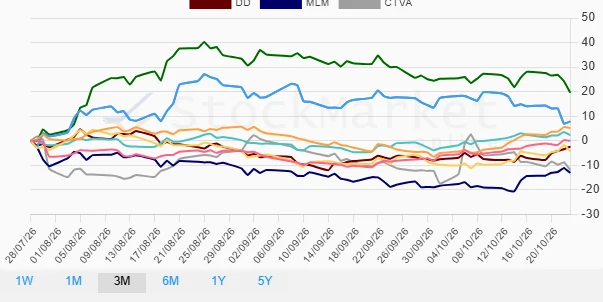
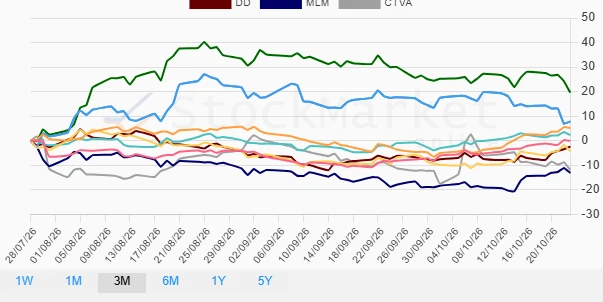
Material Stocks Performance Three Months 📊
Over the last three months, NEM achieved a remarkable 19.65% increase, indicating solid strength. Conversely, MLM suffered a -13.08% decline, underscoring its volatility. Such extremes characterize the dynamic nature of material stocks in this timeframe.
| Stock | Performance (%) | Performance |
|---|---|---|
| NEM | 19.65 | |
| FCX | 7.83 | |
| APD | 5.21 | |
| ECL | 2.32 | |
| LIN | -0.04 | |
| DD | -2.39 | |
| SHW | -4.24 | |
| CTVA | -11.90 | |
| MLM | -13.08 |
Summary 🗣️
The performance of materials stocks over the past quarter underscores the volatility and potential for substantial gains and losses within this sector. NEM has consistently been a top performer, particularly on a longer scale, suggesting a stronger market positioning amidst fluctuating conditions. Conversely, MLM faced challenges, notably over three months, highlighting potential vulnerabilities. Investors should weigh these dynamics and consider diversification strategies to balance risk and opportunity in this ever-evolving sector.
Smart Data Insight
Master the Perfect Entry & Exit for this Stock
Don't leave your profits to chance. Historically, this stock follows specific seasonal patterns that institutional traders use to maximize returns.
- ✅ Identify the "Golden Buying Window"
- ✅ Avoid high-risk correction cycles
- ✅ Backtested data from the last 20+ years