August 25, 2025 a 09:16 am


Material Stocks - Performance Analysis
The materials sector has exhibited noteworthy variability across various timescales. Recent data indicate robust performances among select stocks, juxtaposed with notable volatility. By examining the one-week, one-month, and three-month trajectories of key material sector stocks, this analysis provides a comprehensive view of sectoral dynamics, spotlighting top performers and underperformers.
📊 Material Stocks Performance One Week
| Stock | Performance (%) | Performance |
|---|---|---|
| DD | 5.57 | |
| SHW | 3.91 | |
| APD | 3.82 | |
| FCX | 3.68 | |
| NEM | 2.60 | |
| CTVA | 1.48 | |
| ECL | 1.32 | |
| MLM | 0.85 | |
| LIN | 0.66 |
📊 Material Stocks Performance One Month
| Stock | Performance (%) | Performance |
|---|---|---|
| SHW | 9.46 | |
| NEM | 7.66 | |
| ECL | 4.45 | |
| MLM | 3.93 | |
| DD | 2.33 | |
| LIN | 1.91 | |
| APD | 0.17 | |
| CTVA | 0.02 | |
| FCX | -2.90 |
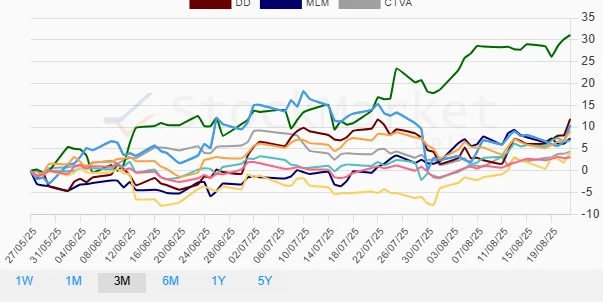
📊 Material Stocks Performance Three Months
| Stock | Performance (%) | Performance |
|---|---|---|
| NEM | 31.09 | |
| DD | 11.84 | |
| FCX | 10.43 | |
| APD | 9.01 | |
| MLM | 7.41 | |
| ECL | 6.93 | |
| CTVA | 4.41 | |
| SHW | 4.37 | |
| LIN | 3.09 |
🔍 Summary
Overall, the materials sector has demonstrated a mixed performance over the analyzed periods. While stocks such as NEM have shown exceptional growth particularly over a three-month period, others like FCX experienced some degree of volatility. It is essential to recognize the fluctuating nature of the sector, which can be attributed to broader market dynamics and sector-specific trends. For investors, a diversified approach within this sector could mitigate risks associated with such fluctuations and potentially capture the growth opportunities presented by top performers.
Smart Data Insight
Master the Perfect Entry & Exit for this Stock
Don't leave your profits to chance. Historically, this stock follows specific seasonal patterns that institutional traders use to maximize returns.
- ✅ Identify the "Golden Buying Window"
- ✅ Avoid high-risk correction cycles
- ✅ Backtested data from the last 20+ years