November 24, 2025 a 09:17 am


Material Stocks - Performance Analysis
The materials sector has experienced fluctuating performance over the past one week, one month, and three months. Various global economic factors and sector-specific dynamics have impacted these stocks, leading to diverse outcomes. This analysis will detail the top performers and laggards, highlighting significant trends and insights to guide investment decisions.
📊 Material Stocks Performance One Week
| Stock | Performance (%) | Performance |
|---|---|---|
| ECL | 4.49% | |
| SHW | 3.15% | |
| CTVA | 2.59% | |
| MLM | 2.22% | |
| FCX | 2.37% | |
| APD | 1.71% | |
| DD | -0.17% | |
| LIN | -1.22% | |
| NEM | -3.99% |
📈 Material Stocks Performance One Month
| Stock | Performance (%) | Performance |
|---|---|---|
| DD | 13.61% | |
| CTVA | 3.09% | |
| APD | 1.51% | |
| SHW | 1.25% | |
| NEM | 1.06% | |
| MLM | -2.85% | |
| FCX | -3.11% | |
| ECL | -3.47% | |
| LIN | -7.60% |
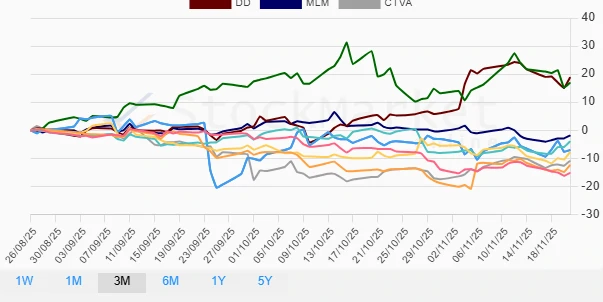
📉 Material Stocks Performance Three Months
| Stock | Performance (%) | Performance |
|---|---|---|
| DD | 18.85% | |
| NEM | 16.94% | |
| MLM | -1.88% | |
| ECL | -3.93% | |
| FCX | -7.06% | |
| SHW | -7.72% | |
| CTVA | -10.85% | |
| APD | -12.39% | |
| LIN | -15.17% |
💡 Summary
In the last three months, DuPont (DD) and Newmont (NEM) emerged as strong performers, suggesting significant positive movements potentially driven by strategic initiatives and favorable market conditions. While short-term volatility was evident, as seen in Ecolab's (ECL) short-term gains, the materials sector continues to show resilience. Investors should remain cautious of broader economic impacts yet consider the promising trajectory of key players within the sector.
Smart Data Insight
Master the Perfect Entry & Exit for this Stock
Don't leave your profits to chance. Historically, this stock follows specific seasonal patterns that institutional traders use to maximize returns.
- ✅ Identify the "Golden Buying Window"
- ✅ Avoid high-risk correction cycles
- ✅ Backtested data from the last 20+ years