
August 24, 2026 a 09:17 am


Material Stocks - Performance Analysis
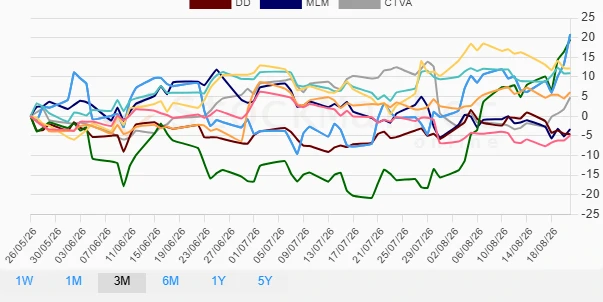
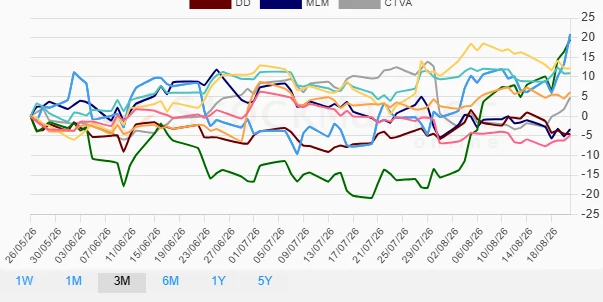
📊 The materials sector has shown varying degrees of performance across different time frames. In the recent analysis, we observe a mixture of significant advancements and setbacks for key players. Understanding these dynamics is essential for crafting informed investment strategies.
Material Stocks Performance One Week
| Stock | Performance (%) | Performance |
|---|---|---|
| FCX | 11.89 | |
| NEM | 9.37 | |
| CTVA | 7.41 | |
| LIN | 2.76 | |
| ECL | 2.12 | |
| APD | 1.43 | |
| MLM | -0.59 | |
| SHW | -0.91 | |
| DD | -3.31 |
Material Stocks Performance One Month
| Stock | Performance (%) | Performance |
|---|---|---|
| NEM | 35.78 | |
| FCX | 21.33 | |
| SHW | 9.44 | |
| ECL | 4.87 | |
| APD | 2.58 | |
| DD | 0.75 | |
| MLM | -3.98 | |
| LIN | -4.68 | |
| CTVA | -7.69 |
Material Stocks Performance Three Months
| Stock | Performance (%) | Performance |
|---|---|---|
| FCX | 20.88 | |
| NEM | 19.49 | |
| SHW | 12.15 | |
| ECL | 10.92 | |
| APD | 6.10 | |
| CTVA | 4.75 | |
| MLM | -3.30 | |
| DD | -4.57 | |
| LIN | -4.88 |
Summary
✅ In conclusion, the materials sector has demonstrated significant volatility with some stocks performing remarkably well, especially in shorter durations like one month. Major players like NEM and FCX have shown sturdy growth patterns over both the one-month and three-month periods. However, the sector is not without its underperformers, such as CTVA and DD, which have struggled in certain periods. A careful approach towards investment in this sector is advised, with a focus on embracing top performers and observing the trends for opportunities among currently underperforming stocks.
Smart Data Insight
Master the Perfect Entry & Exit for this Stock
Don't leave your profits to chance. Historically, this stock follows specific seasonal patterns that institutional traders use to maximize returns.
- ✅ Identify the "Golden Buying Window"
- ✅ Avoid high-risk correction cycles
- ✅ Backtested data from the last 20+ years