September 22, 2025 a 09:16 am


Material Stocks - Performance Analysis
📊 The materials sector demonstrates a diversified performance across various periods. With stock values reflecting broader economic and sector-specific trends, careful attention is warranted for investment strategies. This analysis explores the recent performance of major stocks in the sector to reveal opportunities and risks. 📈
Material Stocks Performance One Week
🔍 Over a short span of one week, the materials sector displayed mixed results. Amid economic uncertainties, investors reacted to macroeconomic indicators. The data highlights shifting sentiments.
| Stock | Performance (%) | Performance |
|---|---|---|
| NEM | 3.02% | |
| DD | 1.29% | |
| MLM | 1.24% | |
| CTVA | 1.13% | |
| LIN | 0.51% | |
| APD | 0.25% | |
| FCX | -1.53% | |
| ECL | -1.88% | |
| SHW | -2.92% |
✅ Conclusion: NEM emerged as a strong performer with a 3.02% increase, while SHW underperformed substantially, indicating potential sectorial rotation or specific challenges impacting individual companies.
Material Stocks Performance One Month
🔍 Over the past month, the materials sector experienced varied dynamics, with some stocks markedly outperforming others. Economic conditions potentially affected the demand and supply dynamics, impacting stock prices.
| Stock | Performance (%) | Performance |
|---|---|---|
| NEM | 14.62% | |
| FCX | 4.18% | |
| MLM | 1.87% | |
| DD | 1.11% | |
| CTVA | -3.22% | |
| APD | -3.01% | |
| ECL | -6.53% | |
| LIN | -0.48% | |
| SHW | -7.07% |
✅ Conclusion: NEM dominated the month with a substantial 14.62% gain, signaling possible strategic successes or favorable sector conditions. Conversely, SHW's -7.07% decline requires closer scrutiny for underlying issues. ⚠️
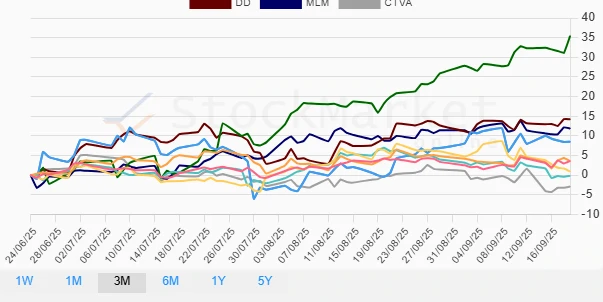
Material Stocks Performance Three Months
🔍 Analyzing the tri-monthly performance offers a broader perspective on market trends, performance consistencies, and evolving investor strategies. Certain stocks demonstrated remarkable resilience and growth potential.
| Stock | Performance (%) | Performance |
|---|---|---|
| NEM | 35.46% | |
| DD | 14.24% | |
| MLM | 11.86% | |
| FCX | 8.48% | |
| LIN | 3.59% | |
| APD | 3.54% | |
| SHW | 0.90% | |
| ECL | -0.19% | |
| CTVA | -2.91% |
✅ Conclusion: NEM sustained its superior status over the three-month period with an impressive 35.46% rise, while CTVA faced headwinds, reflecting a complex market environment. Investment strategies should consider both momentum and fundamentals. 💡
Summary
📈 The materials sector exhibited distinct performance patterns across three horizons. NEM consistently outperformed across all periods, driven by strategic initiatives and possible favorable macroeconomic factors. Conversely, stocks like SHW and CTVA highlight potential volatility and sectoral challenges. Investors must adopt a dual approach incorporating technical and fundamental analyses to navigate this sector effectively. Strategic alignment with macroeconomic conditions could leverage growth opportunities while mitigating potential risks. ✅
Smart Data Insight
Master the Perfect Entry & Exit for this Stock
Don't leave your profits to chance. Historically, this stock follows specific seasonal patterns that institutional traders use to maximize returns.
- ✅ Identify the "Golden Buying Window"
- ✅ Avoid high-risk correction cycles
- ✅ Backtested data from the last 20+ years