
June 22, 2026 a 09:16 am

📊 Material Stocks - Performance Analysis
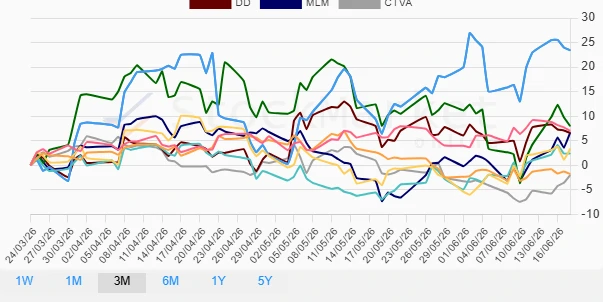
The materials sector has exhibited varied performance across different timeframes, highlighting both opportunities and risks for investors. While some companies have demonstrated robust growth, others have faced challenges impacting their stock prices. This analysis provides a detailed examination of the materials sector's top performers and underperformers over periods of one week, one month, and three months.
📈 Material Stocks Performance One Week
| Stock | Performance (%) | Performance |
|---|---|---|
| CTVA | 3.76 | |
| MLM | 3.47 | |
| SHW | 0.24 | |
| ECL | 0.23 | |
| DD | -1.72 | |
| APD | -0.98 | |
| NEM | -1.83 | |
| LIN | -1.80 | |
| FCX | -2.07 |
📈 Material Stocks Performance One Month
| Stock | Performance (%) | Performance |
|---|---|---|
| MLM | 13.21 | |
| FCX | 11.47 | |
| ECL | 6.32 | |
| SHW | 4.07 | |
| DD | -0.46 | |
| LIN | -0.93 | |
| CTVA | -1.10 | |
| NEM | -2.51 | |
| APD | -3.15 |
📈 Material Stocks Performance Three Months
| Stock | Performance (%) | Performance |
|---|---|---|
| FCX | 23.44 | |
| NEM | 7.99 | |
| LIN | 7.00 | |
| MLM | 6.64 | |
| DD | 6.60 | |
| SHW | 3.35 | |
| ECL | 2.42 | |
| APD | -1.79 | |
| CTVA | -1.99 |
🔍 Summary
The analysis of the materials sector over the past three months indicates significant positive trends, particularly for stocks like Freeport-McMoRan (FCX) and Martin Marietta Materials (MLM), which have shown strong growth. Conversely, APD and CTVA have struggled with consistent declines across different periods. These insights suggest potential opportunities for investors in the high-performing stocks while underscoring the necessity for caution with underperformers. A diversified approach, incorporating both robust performers and cautious positions on weaker stocks, might be advisable given the dynamic nature of the materials sector.
Smart Data Insight
Master the Perfect Entry & Exit for this Stock
Don't leave your profits to chance. Historically, this stock follows specific seasonal patterns that institutional traders use to maximize returns.
- ✅ Identify the "Golden Buying Window"
- ✅ Avoid high-risk correction cycles
- ✅ Backtested data from the last 20+ years