July 21, 2025 a 09:16 am


Material Stocks - Performance Analysis
In the dynamic materials sector, stock performance can fluctuate significantly over short periods, presenting both opportunities and risks for investors. By analyzing the performances over the past week, month, and quarter, we can identify trends and evaluate which stocks have outperformed or underperformed their peers. This comprehensive assessment aims to provide investors with insights into potential investment opportunities and risks in the materials sector.
📊 Material Stocks Performance One Week
| Stock | Performance (%) | Performance |
|---|---|---|
| APD | 1.57 | |
| DD | 0.94 | |
| ECL | 0.20 | |
| MLM | 0.11 | |
| CTVA | -0.07 | |
| LIN | -0.78 | |
| SHW | -1.28 | |
| FCX | -1.78 | |
| NEM | -4.24 |
📊 Material Stocks Performance One Month
| Stock | Performance (%) | Performance |
|---|---|---|
| DD | 13.49 | |
| FCX | 11.36 | |
| APD | 8.89 | |
| MLM | 5.06 | |
| ECL | 2.91 | |
| SHW | 2.14 | |
| LIN | 2.05 | |
| NEM | 0.46 | |
| CTVA | -0.79 |
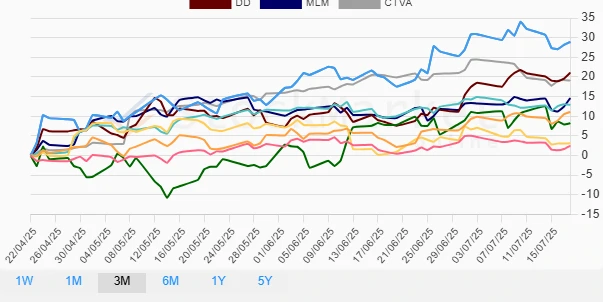
📊 Material Stocks Performance Three Months
| Stock | Performance (%) | Performance |
|---|---|---|
| FCX | 28.89 | |
| DD | 21.05 | |
| CTVA | 19.08 | |
| MLM | 14.59 | |
| ECL | 12.92 | |
| APD | 11.08 | |
| NEM | 8.22 | |
| SHW | 3.09 | |
| LIN | 2.47 |
🔍 Summary
Across the three time frames, certain material stocks have shown consistent strength while others have struggled. In the one-week period, DD and APD were the top performers as NEM and FCX lagged. Over one month, DD led the field with a robust 13.49% increase, suggesting strong momentum, while CTVA showed some weakness. For the three-month overview, FCX stands out with a remarkable gain of 28.89%, highlighting its potential as a leading choice in the materials sector. Investors should consider these performance trends when making strategic decisions, keeping in mind potential market volatility and sector-specific risks.
Smart Data Insight
Master the Perfect Entry & Exit for this Stock
Don't leave your profits to chance. Historically, this stock follows specific seasonal patterns that institutional traders use to maximize returns.
- ✅ Identify the "Golden Buying Window"
- ✅ Avoid high-risk correction cycles
- ✅ Backtested data from the last 20+ years