October 20, 2025 a 09:16 am


Material Stocks - Performance Analysis
This performance analysis of the materials sector over varying time frames unveils a sector grappling with volatility. Key players exhibit both resilience and decline, reflective of broader market dynamics and sector-specific challenges. A sharp focus on economic indicators and policy changes will be essential to navigate future performance in this sector.
📊 Material Stocks Performance One Week
| Stock | Performance (%) | Performance |
|---|---|---|
| DD | 4.70% | |
| ECL | 2.43% | |
| NEM | 2.02% | |
| SHW | -0.42% | |
| LIN | -1.22% | |
| MLM | -1.98% | |
| CTVA | -2.02% | |
| APD | -2.94% | |
| FCX | -3.78% |
📊 Material Stocks Performance One Month
| Stock | Performance (%) | Performance |
|---|---|---|
| NEM | 11.34% | |
| ECL | 4.31% | |
| DD | 2.29% | |
| MLM | 1.27% | |
| SHW | -4.65% | |
| LIN | -5.94% | |
| FCX | -6.19% | |
| APD | -13.35% | |
| CTVA | -13.58% |
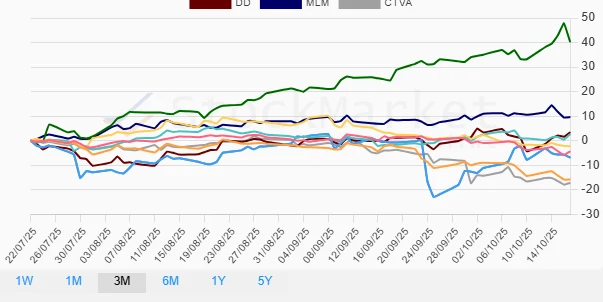
📊 Material Stocks Performance Three Months
| Stock | Performance (%) | Performance |
|---|---|---|
| NEM | 40.21% | |
| MLM | 9.63% | |
| DD | 3.47% | |
| ECL | 2.68% | |
| SHW | -2.25% | |
| LIN | -4.32% | |
| FCX | -6.89% | |
| APD | -15.81% | |
| CTVA | -17.22% |
✅ Summary
This three-tiered analysis spotlights DuPont (DD) and Newmont (NEM) as high-performing stocks with consistent upward trajectories in different timeframes. However, companies like Corteva (CTVA) and Air Products (APD) demonstrate significant underperformance, warranting caution. Diversification into both thriving stocks and those with potential for recovery can offer balanced exposure in volatile sectors such as materials. A keen eye on macroeconomic indicators and sector-specific shifts remains imperative for informed investment decisions.
Smart Data Insight
Master the Perfect Entry & Exit for this Stock
Don't leave your profits to chance. Historically, this stock follows specific seasonal patterns that institutional traders use to maximize returns.
- ✅ Identify the "Golden Buying Window"
- ✅ Avoid high-risk correction cycles
- ✅ Backtested data from the last 20+ years