
October 19, 2026 a 09:16 am


Material Stocks - Performance Analysis 📊
The materials sector has exhibited mixed performance over recent periods. Through a detailed examination of the largest stocks within the sector, notable volatility is observed. This analysis aims to uncover key trends and provide insights into investor sentiment across different time frames.
Material Stocks Performance One Week 📈
An analysis of the one-week performance reveals significant movements among materials stocks. Air Products & Chemicals (APD) led the gains, while Freeport-McMoRan (FCX) faced the largest decline, indicating diverse drivers impacting individual stock performance.
| Stock | Performance (%) | Performance |
|---|---|---|
| APD | 5.43 | |
| MLM | 4.95 | |
| SHW | 4.65 | |
| LIN | 2.27 | |
| ECL | 1.62 | |
| NEM | 1.40 | |
| DD | 0.87 | |
| CTVA | -3.13 | |
| FCX | -5.17 |
Material Stocks Performance One Month 📉
The one-month performance shows significant variation with Linde (LIN) achieving substantial gains of over 8%, whereas Newmont (NEM) lagged with a decline. This indicates potential sector-specific challenges and opportunities.
| Stock | Performance (%) | Performance |
|---|---|---|
| LIN | 8.02 | |
| ECL | 7.07 | |
| APD | 5.45 | |
| SHW | 4.63 | |
| MLM | 2.30 | |
| DD | 1.24 | |
| CTVA | 0.10 | |
| FCX | -2.50 | |
| NEM | -3.50 |
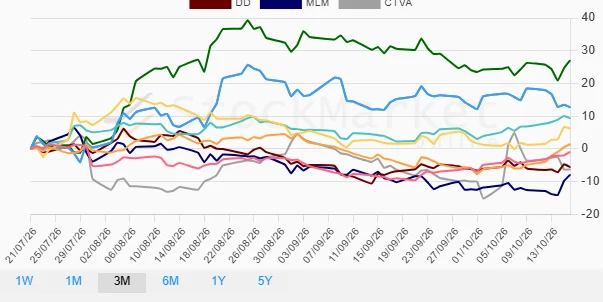
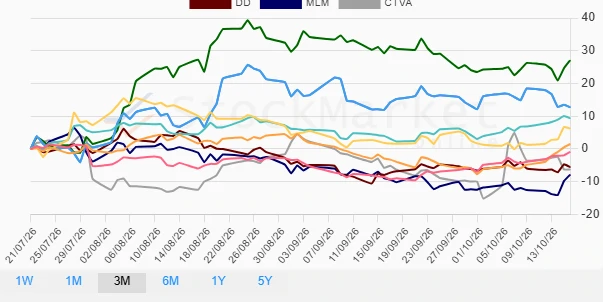
Material Stocks Performance Three Months 🔍
Over the last three months, Newmont (NEM) emerged as the top performer with a prominent gain, suggesting resilience against broader market challenges. However, Martin Marietta Materials (MLM) faced notable downward pressure, pointing to potential headwinds.
| Stock | Performance (%) | Performance |
|---|---|---|
| NEM | 27.09 | |
| FCX | 12.74 | |
| ECL | 9.37 | |
| SHW | 6.22 | |
| APD | 1.51 | |
| LIN | -0.91 | |
| CTVA | -6.27 | |
| DD | -5.57 | |
| MLM | -7.87 |
Summary 💡
Overall, the materials sector is experiencing notable volatility, with some stocks showing robust growth while others struggle to maintain momentum. The mixed performance across different time frames underscores the sector’s sensitivity to broader economic factors and market conditions. Investors are advised to remain cautious, balancing their portfolios to hedge against volatility while seizing growth opportunities. In-depth analysis and strategic stock selection are crucial in navigating this complex landscape.
Smart Data Insight
Master the Perfect Entry & Exit for this Stock
Don't leave your profits to chance. Historically, this stock follows specific seasonal patterns that institutional traders use to maximize returns.
- ✅ Identify the "Golden Buying Window"
- ✅ Avoid high-risk correction cycles
- ✅ Backtested data from the last 20+ years