
May 18, 2026 a 09:16 am



Material Stocks - Performance Analysis
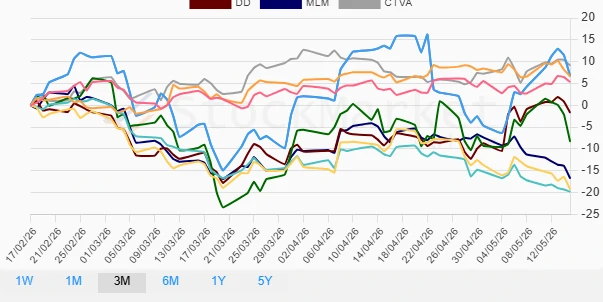
📊The materials sector has demonstrated varying performance trends over recent periods. This analysis dives into the dynamics observed in the past week, month, and quarter, providing insights into market movements, stock volatility, and sector-wide shifts. The performance analysis will help identify top and under-performing stocks, offering a holistic view of the sector's landscape.
Material Stocks Performance One Week
🔍In the past week, some material stocks outperformed while others underwent substantial losses. Notably, LIN was the only stock to show positive growth, highlighting resilience amidst general sector volatility.
| Stock | Performance (%) | Performance |
|---|---|---|
| LIN | 0.36% | |
| CTVA | -0.74% | |
| ECL | -1.40% | |
| FCX | -1.96% | |
| DD | -2.49% | |
| APD | -3.01% | |
| SHW | -4.05% | |
| MLM | -4.73% | |
| NEM | -9.88% |
Material Stocks Performance One Month
📈Over the past month, DD and LIN have notably advanced, while SHW and ECL exhibited significant declines. This indicates varied investor sentiment within the sector.
| Stock | Performance (%) | Performance |
|---|---|---|
| DD | 4.70% | |
| LIN | 2.97% | |
| CTVA | 2.54% | |
| APD | 1.40% | |
| NEM | -5.26% | |
| FCX | -9.13% | |
| MLM | -10.57% | |
| ECL | -10.23% | |
| SHW | -13.80% |
Material Stocks Performance Three Months
📉Among the reviewed stocks over three months, CTVA achieved notable gains, while ECL and SHW experienced the highest declines, reflecting the evolving market conditions in the materials sector.
| Stock | Performance (%) | Performance |
|---|---|---|
| CTVA | 9.10% | |
| FCX | 6.72% | |
| APD | 6.65% | |
| LIN | 5.34% | |
| DD | -1.72% | |
| NEM | -8.37% | |
| MLM | -16.76% | |
| SHW | -19.31% | |
| ECL | -19.80% |
Summary
✅Overall, while certain stocks within the materials sector demonstrated resilience and growth, others faced declines due to shifting market conditions. LIN has shown consistent performance over all observed periods, while SHW and ECL need careful monitoring. Future investment strategies should factor in these dynamics, emphasizing diversified portfolios to mitigate sector-specific risks.
Smart Data Insight
Master the Perfect Entry & Exit for this Stock
Don't leave your profits to chance. Historically, this stock follows specific seasonal patterns that institutional traders use to maximize returns.
- ✅ Identify the "Golden Buying Window"
- ✅ Avoid high-risk correction cycles
- ✅ Backtested data from the last 20+ years