November 17, 2025 a 09:16 am


Material Stocks - Performance Analysis
📊 The materials sector has been observed to show variability in stock performance over different periods. By analyzing short-term, medium-term, and long-term data, we can identify the stocks that pose as top performers as well as those that underperform. This analysis will use recent data to deduce trends and performance patterns.
Material Stocks Performance One Week
💡 The one-week performance demonstrates a mixed scenario in the materials sector. CTVA takes the lead with a slight gain while MLM faces the steepest decline.
| Stock | Performance (%) | Performance |
|---|---|---|
| CTVA | 0.68 | |
| LIN | 0.67 | |
| APD | 0.38 | |
| ECL | 0.02 | |
| NEM | -0.36 | |
| DD | -1.29 | |
| FCX | -1.89 | |
| SHW | -3.04 | |
| MLM | -3.31 |
Material Stocks Performance One Month
🗣️ The one-month view shows DuPont (DD) in a commendable position with a strong gain, while ECL exhibited the most significant decline within this timeframe.
| Stock | Performance (%) | Performance |
|---|---|---|
| DD | 18.29 | |
| CTVA | 7.34 | |
| APD | 2.89 | |
| SHW | 0.73 | |
| NEM | -1.88 | |
| FCX | -2.07 | |
| MLM | -4.65 | |
| LIN | -6.16 | |
| ECL | -6.57 |
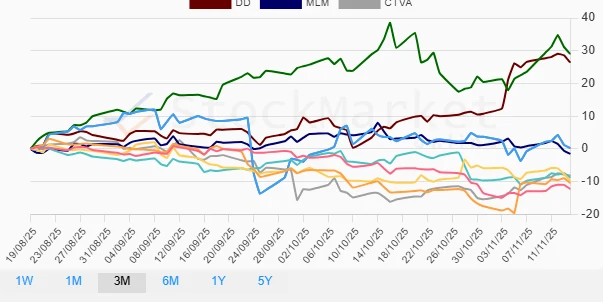
Material Stocks Performance Three Months
🔍 Over the three-month period, Newmont Corporation (NEM) stands out with an impressive gain, whereas LIN experienced the most notable decline.
| Stock | Performance (%) | Performance |
|---|---|---|
| NEM | 29.03 | |
| DD | 26.42 | |
| FCX | 0.29 | |
| MLM | -1.48 | |
| CTVA | -8.13 | |
| ECL | -8.75 | |
| SHW | -9.61 | |
| APD | -10.37 | |
| LIN | -12.21 |
Summary
✅ In conclusion, short-term volatility is evident in the materials sector with mixed results across different stocks and timeframes. Long-term investors may find promise in stocks like NEM and DD, which show consistent positive performance over three months. However, caution is advised for stocks like LIN and ECL, which exhibit downward trends. Diversification and sector-specific strategies would be prudent for managing potential risks and capitalizing on upturns within this volatile sector.
Smart Data Insight
Master the Perfect Entry & Exit for this Stock
Don't leave your profits to chance. Historically, this stock follows specific seasonal patterns that institutional traders use to maximize returns.
- ✅ Identify the "Golden Buying Window"
- ✅ Avoid high-risk correction cycles
- ✅ Backtested data from the last 20+ years