
August 17, 2026 a 09:16 am

Material Stocks - Performance Analysis
An analytical overview of the recent performance of leading stocks in the materials sector reveals varied dynamics across different timeframes. Short-term fluctuations could indicate volatility, while longer-term trends might reflect strategic business directions and market conditions. Understanding these shifts can aid stakeholders in making informed investment decisions.
📊 Material Stocks Performance One Week
| Stock | Performance (%) | Performance |
|---|---|---|
| DD | 3.31% | |
| NEM | 0.53% | |
| APD | 0.29% | |
| CTVA | 0.27% | |
| MLM | -0.27% | |
| SHW | -1.00% | |
| LIN | -1.96% | |
| ECL | -2.93% | |
| FCX | -5.78% |
🗣️ Material Stocks Performance One Month
| Stock | Performance (%) | Performance |
|---|---|---|
| NEM | 28.18% | |
| FCX | 13.88% | |
| SHW | 8.74% | |
| DD | 8.05% | |
| APD | 4.55% | |
| ECL | 1.40% | |
| MLM | -2.18% | |
| LIN | -5.86% | |
| CTVA | -12.01% |
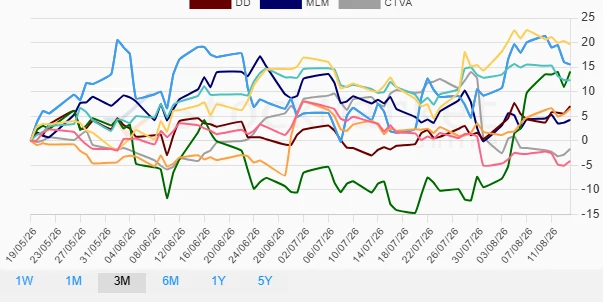
📈 Material Stocks Performance Three Months
| Stock | Performance (%) | Performance |
|---|---|---|
| SHW | 19.64% | |
| FCX | 15.53% | |
| NEM | 14.06% | |
| ECL | 12.32% | |
| DD | 7.03% | |
| APD | 6.55% | |
| MLM | 4.27% | |
| CTVA | -1.66% | |
| LIN | -4.13% |
✅ Summary
The materials sector has demonstrated diverse performance patterns over the examined timeframes. Notably, NEM and FCX showcased remarkable resilience, outperforming across both short and medium-term scales, likely driven by commodity price dynamics and strategic positioning. Conversely, CTVA faced challenges with negative returns, suggesting the need to reevaluate its market strategies. Stakeholders should consider these variances when constructing investment portfolios, particularly giving weight to the consistent outperformers for potential long-term gains.
Smart Data Insight
Master the Perfect Entry & Exit for this Stock
Don't leave your profits to chance. Historically, this stock follows specific seasonal patterns that institutional traders use to maximize returns.
- ✅ Identify the "Golden Buying Window"
- ✅ Avoid high-risk correction cycles
- ✅ Backtested data from the last 20+ years