July 14, 2025 a 09:16 am


Material Stocks - Performance Analysis
📊 The materials sector has witnessed varying degrees of performance over different time frames. This analysis examines the price movements of major stocks within the sector, identifying key performers and potential areas of concern. Understanding these trends is crucial for constructing a balanced portfolio and anticipating future market conditions.
Material Stocks Performance One Week
| Stock | Performance (%) | Performance |
|---|---|---|
| DD | 3.42% | |
| FCX | 2.81% | |
| APD | 1.03% | |
| MLM | 1.03% | |
| NEM | 0.08% | |
| SHW | -0.08% | |
| LIN | -0.17% | |
| ECL | -1.79% | |
| CTVA | -3.98% |
Material Stocks Performance One Month
| Stock | Performance (%) | Performance |
|---|---|---|
| FCX | 13.00% | |
| DD | 12.36% | |
| APD | 4.16% | |
| NEM | 4.13% | |
| MLM | 3.66% | |
| SHW | 3.12% | |
| CTVA | 1.71% | |
| ECL | 1.12% | |
| LIN | 0.65% |
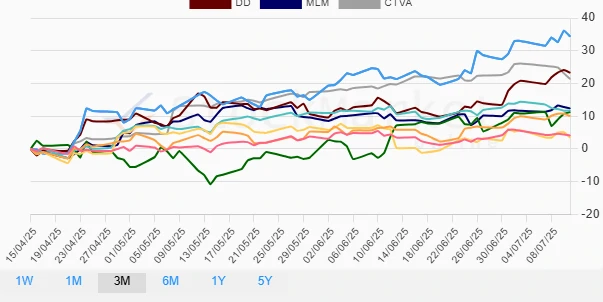
Material Stocks Performance Three Months
| Stock | Performance (%) | Performance |
|---|---|---|
| FCX | 34.35% | |
| DD | 23.27% | |
| CTVA | 21.40% | |
| MLM | 12.39% | |
| ECL | 11.75% | |
| NEM | 11.30% | |
| APD | 10.01% | |
| LIN | 4.11% | |
| SHW | 3.43% |
Summary
✅ Over the three analyzed periods, DD, FCX, and APD have consistently showcased strong performance, emerging as top performers. On the downside, CTVA and ECL experienced significant downturns in shorter periods but managed to recover over longer terms. This trend highlights the importance of diversifying investments within the materials sector to hedge against volatility and unpredictability. These insights serve as an essential tool for investors aiming to maximize returns while effectively managing risks.
Smart Data Insight
Master the Perfect Entry & Exit for this Stock
Don't leave your profits to chance. Historically, this stock follows specific seasonal patterns that institutional traders use to maximize returns.
- ✅ Identify the "Golden Buying Window"
- ✅ Avoid high-risk correction cycles
- ✅ Backtested data from the last 20+ years