
October 13, 2025 a 09:16 am


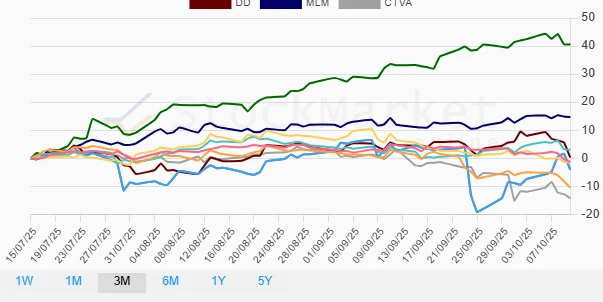

Material Stocks - Performance Analysis
The materials sector has experienced significant volatility over recent weeks, reflecting broader market uncertainties and sector-specific challenges. This analysis provides a deep dive into the weekly, monthly, and quarterly performances of key stocks within the sector. By examining these trends, investors can better understand the dynamic landscape and prepare for future market moves.
Material Stocks Performance One Week
| Stock | Performance (%) | Performance |
|---|---|---|
| FCX | 1.69% | |
| MLM | -0.58% | |
| SHW | -1.21% | |
| ECL | -2.72% | |
| LIN | -3.17% | |
| NEM | -3.78% | |
| CTVA | -3.81% | |
| APD | -5.20% | |
| DD | -9.05% |
Material Stocks Performance One Month
| Stock | Performance (%) | Performance |
|---|---|---|
| NEM | 7.48% | |
| MLM | 2.72% | |
| ECL | -0.06% | |
| DD | -4.40% | |
| FCX | -6.53% | |
| SHW | -7.79% | |
| LIN | -5.93% | |
| APD | -12.76% | |
| CTVA | -17.47% |
Material Stocks Performance Three Months
| Stock | Performance (%) | Performance |
|---|---|---|
| NEM | 40.60% | |
| MLM | 14.69% | |
| ECL | 3.07% | |
| DD | 0.32% | |
| LIN | -1.24% | |
| SHW | -1.33% | |
| FCX | -4.01% | |
| APD | -10.38% | |
| CTVA | -14.27% |
Summary
The materials sector exhibits both opportunities and challenges, with performances varying greatly over different time frames. Over the week, Freeport-McMoRan (FCX) was the top gainer, while DuPont (DD) underperformed. On a monthly scale, NEM emerged as a strong contender despite broader market downturns, while CTVA saw significant losses. The three-month analysis highlighted NEM with a remarkable 40% rise, overshadowing other stocks, and reaffirmed the volatility in the sector. Investors should exercise caution, considering the mixed performances and sector-specific risks. A diversified approach may be advisable to navigate this unpredictable landscape effectively.
Smart Data Insight
Master the Perfect Entry & Exit for this Stock
Don't leave your profits to chance. Historically, this stock follows specific seasonal patterns that institutional traders use to maximize returns.
- ✅ Identify the "Golden Buying Window"
- ✅ Avoid high-risk correction cycles
- ✅ Backtested data from the last 20+ years