April 13, 2026 a 09:16 am


Material Stocks - Performance Analysis
This analysis assesses the performance of major stocks in the materials sector over varying timeframes. With notable volatility observed, these stocks have demonstrated varied performance driven by both macroeconomic factors and sector-specific dynamics. An examination of one-week, one-month, and three-month data periods underscores key trends and pinpointed all-time highs and lows across the sector. Such insights deliver a valuable vantage point for strategic portfolio adjustments.
Material Stocks Performance One Week 📊
| Stock | Performance (%) | Performance |
|---|---|---|
| FCX | 10.76% | |
| NEM | 6.98% | |
| SHW | 6.27% | |
| MLM | 5.50% | |
| DD | 3.75% | |
| ECL | 2.42% | |
| APD | 1.56% | |
| LIN | 0.74% | |
| CTVA | -0.49% |
The materials sector showcased a varied performance across stocks over the past week. FCX emerged as the top performer with an impressive uptick of 10.76%. In contrast, CTVA saw a slight decline slipping by 0.49%. Such diversity underscores the importance of tactical allocation and highlights FCX's robust resilience in the face of market flux.
Material Stocks Performance One Month 📉
| Stock | Performance (%) | Performance |
|---|---|---|
| FCX | 19.57% | |
| NEM | 10.68% | |
| MLM | 8.19% | |
| CTVA | 5.85% | |
| DD | 5.61% | |
| SHW | 5.42% | |
| APD | 3.75% | |
| LIN | 1.97% | |
| ECL | -0.04% |
Over a one-month horizon, FCX again led the field with a commanding 19.57% increase, consolidating its status as a market leader. The mid-tier performers, NEM and MLM, showed solid gains above 8%. Meanwhile, ECL marginally contracted by 0.04%, illustrating the competitive dynamics and inherent risks of the materials sector.
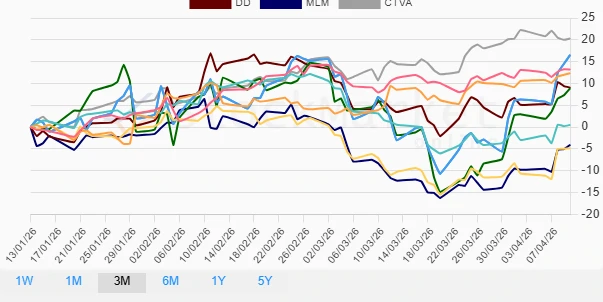
Material Stocks Performance Three Months 📈
| Stock | Performance (%) | Performance |
|---|---|---|
| CTVA | 20.32% | |
| FCX | 16.55% | |
| LIN | 13.22% | |
| APD | 12.32% | |
| DD | 9.05% | |
| NEM | 8.88% | |
| ECL | 0.51% | |
| MLM | -4.07% | |
| SHW | -4.87% |
The three-month review places CTVA at the forefront with a substantial hike of 20.32%, surpassing its contemporaries. FCX continued its strong performance with a remarkable 16.55% rise. Conversely, MLM and SHW faced challenges over this period, declining by 4.07% and 4.87%, respectively. These insights highlight CTVA's growth potential and strategic acumen, with the need for MLM and SHW to reassess market positioning.
Summary 🗣️
In summary, the materials sector demonstrates a dynamic tableau of performances, with FCX consistently showing robust growth potential across all periods examined. CTVA showed leading gains in the longer three-month assessment. However, caution is advised as evidenced by the declines seen in SHW and MLM. Investors may find value in diversifying holdings by focusing on the outperforming stocks while carefully monitoring the underperformers for signs of turnaround or further decline.
Smart Data Insight
Master the Perfect Entry & Exit for this Stock
Don't leave your profits to chance. Historically, this stock follows specific seasonal patterns that institutional traders use to maximize returns.
- ✅ Identify the "Golden Buying Window"
- ✅ Avoid high-risk correction cycles
- ✅ Backtested data from the last 20+ years