
October 12, 2026 a 09:16 am


Material Stocks - Performance Analysis
📊 The materials sector has shown a mixed performance across different time frames, with some stocks outperforming significantly in certain periods while others have struggled. This analysis highlights the one-week, one-month, and three-month performances of key stocks within the sector, offering insights into market trends and investor sentiment.
Material Stocks Performance One Week
🔍 Over the past week, the materials sector experienced variable performance. CTVA emerged as the standout performer with a significant gain, while MLM lagged the most. Overall, the week saw positive movement for most stocks.
| Stock | Performance (%) | Performance |
|---|---|---|
| CTVA | 7.60% | |
| NEM | 1.79% | |
| ECL | 1.72% | |
| FCX | 1.56% | |
| APD | 0.65% | |
| SHW | 0.32% | |
| LIN | 0.30% | |
| DD | -0.47% | |
| MLM | -1.46% |
Material Stocks Performance One Month
🗣️ The monthly performance displayed divergent trends. FCX led the pack with notable gains while NEM faced substantial declines. This indicates strategic shifts or market reactions unique to each company.
| Stock | Performance (%) | Performance |
|---|---|---|
| FCX | 3.94% | |
| DD | 2.50% | |
| ECL | 2.11% | |
| LIN | 3.75% | |
| SHW | -1.08% | |
| CTVA | -1.25% | |
| APD | -3.41% | |
| MLM | -6.22% | |
| NEM | -6.94% |
Material Stocks Performance Three Months
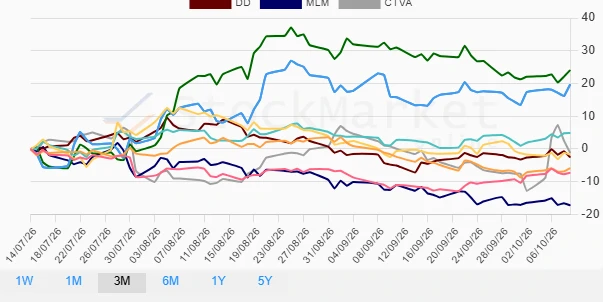
📈 Over the three-month period, NEM and FCX significantly outperformed others, while MLM and LIN faced strong declines. This period reflects major strategic or market influences impacting long-term investor sentiment in the materials sector.
| Stock | Performance (%) | Performance |
|---|---|---|
| NEM | 24.06% | |
| FCX | 19.72% | |
| ECL | 4.85% | |
| CTVA | -1.20% | |
| SHW | -1.73% | |
| DD | -2.55% | |
| APD | -5.83% | |
| LIN | -7.30% | |
| MLM | -17.23% |
Summary
✅ Overall, the materials sector has demonstrated significant variation in stock performance across short, mid, and long-term horizons. Key players such as NEM and FCX have thrived over recent months, while others like MLM have faced challenges. Investors should consider these disparities and keep an eye on market conditions and company fundamentals when making investment decisions in this volatile sector.
Smart Data Insight
Master the Perfect Entry & Exit for this Stock
Don't leave your profits to chance. Historically, this stock follows specific seasonal patterns that institutional traders use to maximize returns.
- ✅ Identify the "Golden Buying Window"
- ✅ Avoid high-risk correction cycles
- ✅ Backtested data from the last 20+ years