
June 08, 2026 a 09:17 am


Material Stocks - Performance Analysis
📊 The materials sector has undergone significant shifts over the observed periods. Notably, short-term volatility has been reflected through varying performances of leading stocks, each affected by macroeconomic factors and sector-specific trends. This analysis provides a detailed evaluation of individual stock performances over one week, one month, and three-month periods. Investors should remain vigilant and adaptive to these market dynamics to capitalize on opportunities and mitigate risks.
Material Stocks Performance One Week
🗓️ Over the past week, Sherwin-Williams (SHW) emerged as the top performer with a notable increase of 3.51%, indicating market confidence in its sectoral positioning. In contrast, Newmont Corporation (NEM) exhibited the most significant decline, down 7.80%, hinting at potential market concerns or sector-specific challenges facing this entity. These fluctuations underscore the importance of diversifying holdings within the materials sector.
| Stock | Performance (%) | Performance |
|---|---|---|
| SHW | 3.51% | |
| ECL | 2.99% | |
| LIN | 2.12% | |
| MLM | 0.87% | |
| APD | 1.24% | |
| CTVA | -0.84% | |
| DD | -1.52% | |
| FCX | -4.94% | |
| NEM | -7.80% |
Material Stocks Performance One Month
🗓️ Within the past month, Freeport-McMoRan (FCX) took the lead with a performance of 4.10%, showing resilience amid market trends. Conversely, Newmont Corporation (NEM) sustained the most substantial loss, diving 14.61%, indicative of continued pressures. The data reveals a pattern of extended volatility, with several key players in the sector experiencing headwinds.
| Stock | Performance (%) | Performance |
|---|---|---|
| FCX | 4.10% | |
| LIN | 3.08% | |
| ECL | 1.62% | |
| MLM | -2.18% | |
| SHW | -3.50% | |
| CTVA | -5.05% | |
| APD | -4.40% | |
| DD | -5.65% | |
| NEM | -14.61% |
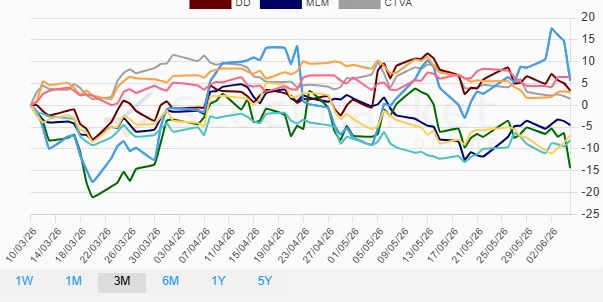
Material Stocks Performance Three Months
🗓️ In the three-month view, Linde (LIN) and Freeport-McMoRan (FCX) surfaced as top performers, with gains of 6.55% and 5.68% respectively. Their performance indicates potential sector strength or effective corporate strategies. On the downside, Newmont Corporation (NEM) yet again showed the most significant downturn, dropping by 14.35%, reaffirming recurring challenges that might deter investments.
| Stock | Performance (%) | Performance |
|---|---|---|
| LIN | 6.55% | |
| FCX | 5.68% | |
| DD | 3.40% | |
| APD | 3.04% | |
| CTVA | 1.53% | |
| MLM | -4.50% | |
| SHW | -6.88% | |
| ECL | -8.01% | |
| NEM | -14.35% |
Summary
✅ The materials sector exhibits a mosaic of performance outcomes, predominantly driven by both external market conditions and internal company strengths. While certain stocks like Linde (LIN) and Freeport-McMoRan (FCX) demonstrate promising growth trajectories, others, especially Newmont Corporation (NEM), face persistent challenges. Investors should carefully balance their portfolios to navigate potential risks while capitalizing on emerging opportunities. The sector's inherently cyclical nature requires a dynamic approach, leveraging diversification and strategic investments for optimizing returns.
Smart Data Insight
Master the Perfect Entry & Exit for this Stock
Don't leave your profits to chance. Historically, this stock follows specific seasonal patterns that institutional traders use to maximize returns.
- ✅ Identify the "Golden Buying Window"
- ✅ Avoid high-risk correction cycles
- ✅ Backtested data from the last 20+ years