
October 05, 2026 a 09:16 am


Material Stocks - Performance Analysis
In the dynamic world of materials stocks, recent market movements over multiple timeframes reveal intriguing trends. In this analysis, we dissect the performance of major stocks within the sector across one-week, one-month, and three-month intervals. This examination provides insights that can guide potential investment decisions and strategic assessments of market behaviors.
📊 Material Stocks Performance One Week
During the past week, stocks within the materials sector displayed varied performances. LIN emerged as the top gainer, while CTVA faced the steepest decline, showcasing the volatility inherent to this market segment. This variation underscores the importance of strategic positioning to capitalize on short-term trends.
| Stock | Performance (%) | Performance |
|---|---|---|
| LIN | 1.59 | |
| FCX | 0.20 | |
| APD | -0.39 | |
| NEM | -0.39 | |
| DD | -0.77 | |
| MLM | -1.71 | |
| ECL | -2.33 | |
| SHW | -4.05 | |
| CTVA | -5.28 |
📊 Material Stocks Performance One Month
The one-month horizon highlighted persistent weaknesses across the sector. LIN remained the least affected amidst a challenging market, while CTVA's significant decline exemplified underlying sectoral pressures.
| Stock | Performance (%) | Performance |
|---|---|---|
| LIN | 0.48 | |
| FCX | -0.35 | |
| DD | -1.11 | |
| ECL | -1.91 | |
| SHW | -4.17 | |
| MLM | -6.34 | |
| APD | -8.05 | |
| NEM | -9.93 | |
| CTVA | -17.37 |
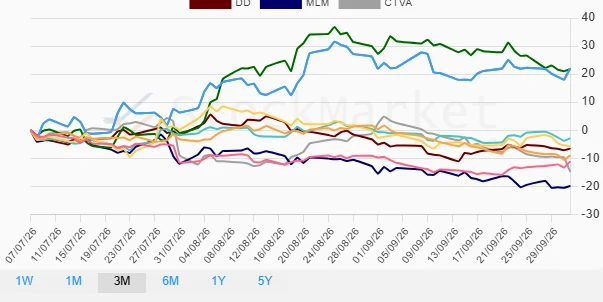
📊 Material Stocks Performance Three Months
Over the three-months period, FCX and NEM delivered remarkable gains despite the overall sector downturn. Conversely, MLM faced the most severe drop, indicating polarizing performance within the market.
| Stock | Performance (%) | Performance |
|---|---|---|
| FCX | 21.99 | |
| NEM | 21.80 | |
| ECL | -2.87 | |
| SHW | -5.75 | |
| DD | -6.55 | |
| APD | -8.98 | |
| LIN | -11.13 | |
| CTVA | -14.80 | |
| MLM | -19.84 |
Summary
✅ The materials stock sector has exhibited significant fluctuations across various timeframes, marked by intermittent gains and pronounced losses. Companies such as FCX and LIN managed short-term resilience, while CTVA consistently struggled. Investors may consider diversifying within the sector or exploring exposure to stocks with positive performance outlooks. As volatility persists, meticulous portfolio management and risk assessment remain crucial.
Smart Data Insight
Master the Perfect Entry & Exit for this Stock
Don't leave your profits to chance. Historically, this stock follows specific seasonal patterns that institutional traders use to maximize returns.
- ✅ Identify the "Golden Buying Window"
- ✅ Avoid high-risk correction cycles
- ✅ Backtested data from the last 20+ years