
November 02, 2026 a 09:16 am


Material Stocks - Performance Analysis
📊 The materials sector, encompassing vital stocks such as LIN, APD, and ECL, has recently exhibited variable performance across different time horizons. This analysis dives into the one-week, one-month, and three-month performance metrics, identifying both top-performers and underperformers. Our analysis leverages these findings to aid strategic investment decisions.
Material Stocks Performance One Week
| Stock | Performance (%) | Performance |
|---|---|---|
| MLM | 7.11 | |
| ECL | 4.80 | |
| APD | 3.46 | |
| DD | 2.76 | |
| LIN | 1.32 | |
| SHW | -0.67 | |
| CTVA | -2.54 | |
| NEM | -3.32 | |
| FCX | -4.04 |
Material Stocks Performance One Month
| Stock | Performance (%) | Performance |
|---|---|---|
| APD | 13.21 | |
| MLM | 11.68 | |
| ECL | 10.28 | |
| DD | 7.64 | |
| LIN | 7.09 | |
| SHW | 4.31 | |
| CTVA | -1.00 | |
| NEM | -7.51 | |
| FCX | -13.71 |
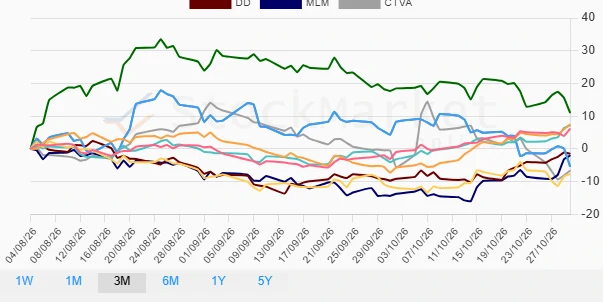
Material Stocks Performance Three Months
| Stock | Performance (%) | Performance |
|---|---|---|
| NEM | 10.99 | |
| APD | 7.53 | |
| ECL | 7.13 | |
| LIN | 6.17 | |
| DD | -1.45 | |
| MLM | -2.01 | |
| CTVA | -6.61 | |
| FCX | -5.39 | |
| SHW | -7.65 |
Summary
✅ Over the recent periods analyzed, MLM and ECL have demonstrated consistent positive performance, especially in the short-term. Notably, APD showcased robust growth over the one-month horizon. Conversely, FCX has struggled across the sampled periods, reflecting potential sectoral or company-specific challenges. Stakeholders may consider reinforcing positions in the positive performers while reevaluating holdings in the underperformers to optimize return potential in the materials sector.
Smart Data Insight
Master the Perfect Entry & Exit for this Stock
Don't leave your profits to chance. Historically, this stock follows specific seasonal patterns that institutional traders use to maximize returns.
- ✅ Identify the "Golden Buying Window"
- ✅ Avoid high-risk correction cycles
- ✅ Backtested data from the last 20+ years