October 31, 2025 a 12:31 pm


Indices - Performance Analysis
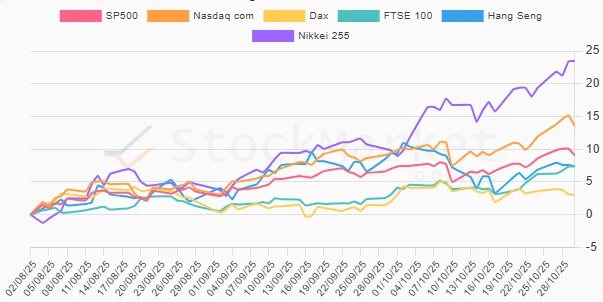
In the recent market performance analysis, indices have exhibited varied performances across different time periods. The data presented provides an in-depth look into short-term and medium-term trends. This evaluation will help in understanding recent market dynamics and identifying potential strategic investment opportunities.
📊 Indices Performance - One Week
| Index | Performance (%) | Performance |
|---|---|---|
| Nikkei 255 | 4.09% | |
| Nasdaq com | 1.64% | |
| FTSE 100 | 1.18% | |
| Hang Seng | 0.48% | |
| SP500 | 0.47% | |
| Dax | -0.50% |
📈 Indices Performance - One Month
| Index | Performance (%) | Performance |
|---|---|---|
| Nikkei 255 | 14.51% | |
| Nasdaq com | 3.75% | |
| FTSE 100 | 3.28% | |
| SP500 | 1.72% | |
| Dax | 0.08% | |
| Hang Seng | -2.01% |
📉 Indices Performance - Three Months
| Index | Performance (%) | Performance |
|---|---|---|
| Nikkei 255 | 23.47% | |
| Nasdaq com | 13.58% | |
| SP500 | 9.08% | |
| FTSE 100 | 7.39% | |
| Hang Seng | 7.35% | |
| Dax | 3.09% |
💡 Summary
Throughout the past quarter, the Nikkei 255 has markedly outperformed other indices, demonstrating a robust growth trajectory. In contrast, the Dax faced challenges with its subdued performance. The performance variations across indices underscore the necessity for diversified investment strategies, leveraging positive momentum while cautiously maneuvering through underperforming markets.
Smart Data Insight
Master the Perfect Entry & Exit for this Stock
Don't leave your profits to chance. Historically, this stock follows specific seasonal patterns that institutional traders use to maximize returns.
- ✅ Identify the "Golden Buying Window"
- ✅ Avoid high-risk correction cycles
- ✅ Backtested data from the last 20+ years