
January 30, 2026 a 12:31 pm

Indices - Performance Analysis
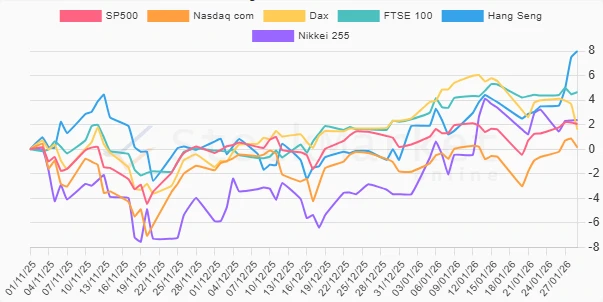
Analyzing the performance of global indices over different time horizons provides valuable insights into market trends and investment opportunities. The recent data reveals substantial fluctuations and varying performance across major stock indices, affecting strategic investment decisions. By identifying the top and underperforming indices, investors can align their approaches to optimize portfolio outcomes.
📊 Indices Performance One Week
| Index | Performance (%) | Performance |
|---|---|---|
| Hang Seng | 4.50% | |
| Nasdaq com | 0.79% | |
| SP500 | 0.77% | |
| FTSE 100 | 0.28% | |
| Nikkei 255 | -0.86% | |
| Dax | -2.38% |
📊 Indices Performance One Month
| Index | Performance (%) | Performance |
|---|---|---|
| Hang Seng | 8.86% | |
| Nikkei 255 | 6.04% | |
| FTSE 100 | 2.41% | |
| Nasdaq com | 1.96% | |
| SP500 | 1.86% | |
| Dax | -0.71% |
📊 Indices Performance Three Months
| Index | Performance (%) | Performance |
|---|---|---|
| Hang Seng | 7.99% | |
| FTSE 100 | 4.65% | |
| Nikkei 255 | 2.37% | |
| SP500 | 2.05% | |
| Dax | 1.60% | |
| Nasdaq com | 0.15% |
🔍 Summary
The performance data over the different periods indicates strong market dynamics. The Hang Seng index showcases exceptional performance on all time horizons, positioning it as a leading growth market. The FTSE 100 and Nikkei 255 also demonstrate significant positive trends, especially in the three-month analysis. Conversely, the Dax index shows underperformance in the one-week analysis but recovers in longer-term views. Investors should consider these trends to adjust their portfolios for optimal performance, particularly focusing on the consistent growth observed in the Hang Seng index.
Smart Data Insight
Master the Perfect Entry & Exit for this Stock
Don't leave your profits to chance. Historically, this stock follows specific seasonal patterns that institutional traders use to maximize returns.
- ✅ Identify the "Golden Buying Window"
- ✅ Avoid high-risk correction cycles
- ✅ Backtested data from the last 20+ years