August 29, 2025 a 12:31 pm


Indices - Performance Analysis
The recent market performance analysis highlights important trends across major global indices. Over the past week, month, and three months, various indices have demonstrated distinct movements, reflecting both regional economic activities and global market sentiments. This analysis delves deeply into the performance metrics, identifies top and underperformers, and extracts meaningful insights for investors and analysts.
📊 Indices Performance One Week
| Index | Performance (%) | Performance |
|---|---|---|
| Nasdaq com | 0.96% | |
| SP500 | 0.54% | |
| Nikkei 255 | 0.47% | |
| FTSE 100 | -1.13% | |
| Hang Seng | -1.32% | |
| Dax | -1.34% |
Indices Performance One Month
| Index | Performance (%) | Performance |
|---|---|---|
| Nikkei 255 | 5.31% | |
| Nasdaq com | 2.79% | |
| SP500 | 2.20% | |
| FTSE 100 | 0.89% | |
| Hang Seng | -0.61% | |
| Dax | -0.84% |
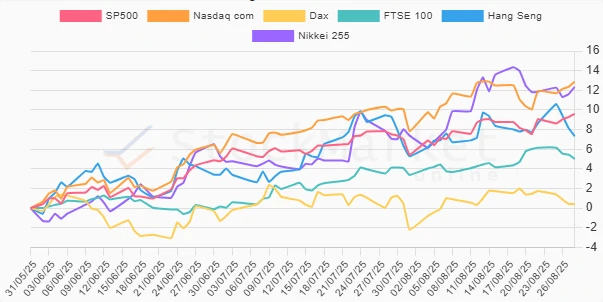
Indices Performance Three Months
| Index | Performance (%) | Performance |
|---|---|---|
| Nasdaq com | 12.88% | |
| Nikkei 255 | 12.33% | |
| SP500 | 9.59% | |
| Hang Seng | 7.34% | |
| FTSE 100 | 5.02% | |
| Dax | 0.41% |
Summary
The indices have shown considerable volatility over various time frames. Nasdaq emerged as a consistent top performer across all periods, reflecting strong tech sector growth. The Nikkei 255 and SP500 have also demonstrated notable strength, particularly over the one-month period. Meanwhile, European indices have experienced mixed results, with the Dax underperforming slightly. These trends suggest a robust tech sector outlook and highlight potential opportunities in US and Asian markets, while European markets may require more cautious observation moving forward.
Smart Data Insight
Master the Perfect Entry & Exit for this Stock
Don't leave your profits to chance. Historically, this stock follows specific seasonal patterns that institutional traders use to maximize returns.
- ✅ Identify the "Golden Buying Window"
- ✅ Avoid high-risk correction cycles
- ✅ Backtested data from the last 20+ years