November 28, 2025 a 12:32 pm


Indices - Performance Analysis
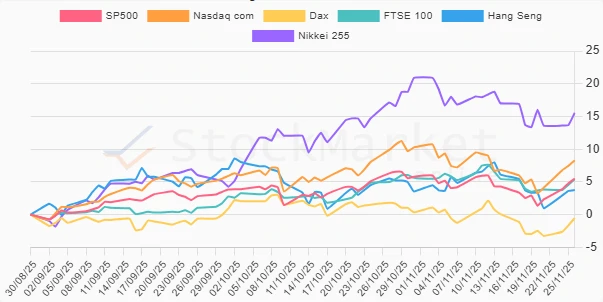
In the recent analysis of key global indices, varying trends are observed across different timeframes. Each period reflects not only the inherent volatility in the financial markets but also showcases standout performers that shape future expectations. This detailed assessment aims to provide a comprehensive view of these dynamic shifts over the past week, month, and three months.
📊 Indices Performance One Week
The one-week analysis indicates strong performances across major indices, particularly within the technology-driven Nasdaq com. This suggests a resurgence of growth optimism amidst macroeconomic stabilisations. Conversely, more conservative indices, such as the FTSE 100, demonstrated modest growth, reflecting different regional economic conditions.
| Index | Performance (%) | Performance |
|---|---|---|
| Nasdaq com | 4.18% | |
| SP500 | 3.15% | |
| Hang Seng | 2.79% | |
| Dax | 2.72% | |
| Nikkei 255 | 1.92% | |
| FTSE 100 | 1.58% |
🗣️ Indices Performance One Month
Over a one-month span, a downward trend is evident, with most indices showing negative returns. The technology-heavy Nasdaq com experienced the most significant decline, indicating potential profit-taking following earlier surges. In contrast, the FTSE 100 proved relatively resilient, underscoring sectoral and regional diversity.
| Index | Performance (%) | Performance |
|---|---|---|
| FTSE 100 | -0.62% | |
| Hang Seng | -1.45% | |
| Dax | -1.58% | |
| SP500 | -1.05% | |
| Nasdaq com | -2.95% | |
| Nikkei 255 | -3.21% |
🔍 Indices Performance Three Months
Over the past three months, indices displayed varied movements, with the Nikkei 255 seeing exceptional gains, powered by economic stimuli and market momentum. The Nasdaq com also experienced robust growth amid favorable tech sector conditions. Meanwhile, the Dax slightly contracted, hinting at regional challenges.
| Index | Performance (%) | Performance |
|---|---|---|
| Nikkei 255 | 15.53% | |
| Nasdaq com | 8.29% | |
| SP500 | 5.49% | |
| FTSE 100 | 5.41% | |
| Hang Seng | 3.76% | |
| Dax | -0.53% |
✅ Summary
Over the analysed periods, the financial markets displayed a diverse range of performances. Overall, optimism is evident in the 3-month horizon, mainly driven by robust growth in indices such as the Nikkei 255, highlighting regional economic recovery strategies. However, the one-month decline underlines potential market corrections amid geopolitical tensions. Stakeholders should remain vigilant of macroeconomic indicators and sectoral shifts for strategic investment planning.
Smart Data Insight
Master the Perfect Entry & Exit for this Stock
Don't leave your profits to chance. Historically, this stock follows specific seasonal patterns that institutional traders use to maximize returns.
- ✅ Identify the "Golden Buying Window"
- ✅ Avoid high-risk correction cycles
- ✅ Backtested data from the last 20+ years