
February 27, 2026 a 12:32 pm


Indices - Performance Analysis
This analysis provides a comprehensive overview of global index performance over three distinct periods: one week, one month, and three months. By examining key indices like the SP500, Nasdaq, and others, we aim to identify trends, highlight top and underperformers, and provide strategic insights into market movements. 📊 Let's delve into the data to interpret current market sentiments and potential future directions.
Indices Performance One Week 🔍
During the past week, the Nikkei 255 stood out with a substantial growth of 3.36%, leading the pack among other global indices. The FTSE 100 also showed solid performance, registering a 1.49% gain. On the other hand, the Hang Seng experienced slight pressure, decreasing by 0.07%. This week's performance indicates a positive trend in Asian markets, chiefly driven by Japan. 🗣️ The SP500, however, remained stable with no change.
| Index | Performance (%) | Performance |
|---|---|---|
| Nikkei 255 | 3.36% | |
| FTSE 100 | 1.49% | |
| Dax | 0.13% | |
| SP500 | 0.00% | |
| Nasdaq com | -0.01% | |
| Hang Seng | -0.07% |
Indices Performance One Month 🔍
Over the one-month period, the Nikkei 255 again performed exceptionally well, with an impressive increase of 9.86%. The FTSE 100 also managed significant growth, marked by a 6.63% rise. Both the SP500 and Nasdaq saw declines, highlighting a divergent trend between Western and Asian markets. Notably, the Hang Seng was the largest decliner, falling by 5.18% as investor sentiment weakened in the region.
| Index | Performance (%) | Performance |
|---|---|---|
| Nikkei 255 | 9.86% | |
| FTSE 100 | 6.63% | |
| Dax | 1.93% | |
| SP500 | -0.95% | |
| Nasdaq com | -4.05% | |
| Hang Seng | -5.18% |
Indices Performance Three Months 🔍
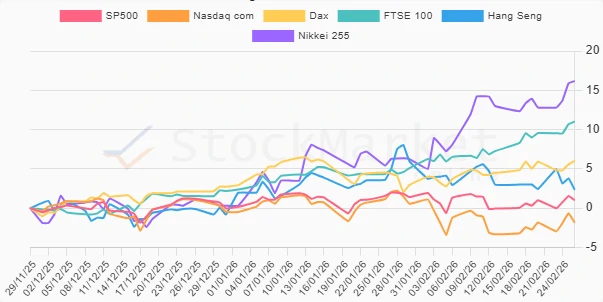
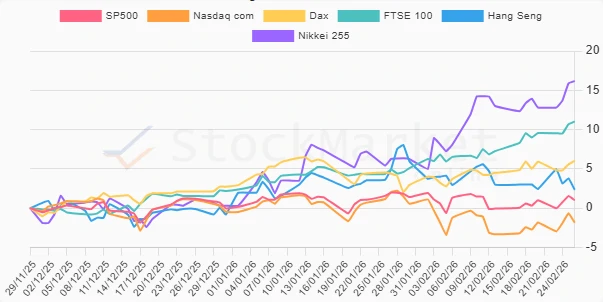
Analyzing over three months, the Nikkei 255 continues to lead with a remarkable 16.17% surge, underscoring its robust market position. The FTSE 100 followed with an 11.04% increase, while the Dax registered a 6.02% gain. Declines were observed in the Nasdaq, highlighting a potential area for concern among technology stocks.
| Index | Performance (%) | Performance |
|---|---|---|
| Nikkei 255 | 16.17% | |
| FTSE 100 | 11.04% | |
| Dax | 6.02% | |
| Hang Seng | 2.35% | |
| SP500 | 1.01% | |
| Nasdaq com | -1.84% |
Summary 🗣️
The data reveals a consistent outperformance by the Nikkei 255, which dominates across all considered time frames, reflecting strong investor confidence in Japanese markets. In contrast, Western indices such as the Nasdaq have struggled, particularly in the one-month and three-month analyses, indicating potential volatility in technology-related equities. The FTSE 100's resilience, particularly in the three-month scope, also warrants attention. To strategize effectively, investors may consider increased focus on Asian markets while being mindful of specific sectors like technology that may offer less stability. Overall, this period underscores the importance of global diversification in portfolio management. 💡
Smart Data Insight
Master the Perfect Entry & Exit for this Stock
Don't leave your profits to chance. Historically, this stock follows specific seasonal patterns that institutional traders use to maximize returns.
- ✅ Identify the "Golden Buying Window"
- ✅ Avoid high-risk correction cycles
- ✅ Backtested data from the last 20+ years