
June 26, 2026 a 12:31 pm


Indices - Performance Analysis
Global indices have displayed diverse performances across selected timeframes. Notably, the 1W and 1M periods indicate a stagnant phase with zero growth recorded across major indices. However, the 3M analysis reveals significant movements, highlighting substantial growth in specific indices. This evaluation aims to provide insights into market trends and future outlooks.
📊 Indices Performance One Week
During the past week, all monitored indices reported unchanged values, indicating a period of consolidation. Such stagnation may suggest market participants are awaiting significant economic data or geopolitical developments before taking decisive action.
| Index | Performance (%) | Performance |
|---|---|---|
| SP500 | 0.0 | |
| Nasdaq com | 0.0 | |
| Dax | 0.0 | |
| FTSE 100 | 0.0 | |
| Hang Seng | 0.0 | |
| Nikkei 255 | 0.0 |
📊 Indices Performance One Month
The previous month reflects a similar trend to the weekly analysis, with all indices indicating no change in performance. This may hint at market saturation or equilibrium in stock pricing, potentially awaiting new fiscal policies or earnings reports.
| Index | Performance (%) | Performance |
|---|---|---|
| SP500 | 0.0 | |
| Nasdaq com | 0.0 | |
| Dax | 0.0 | |
| FTSE 100 | 0.0 | |
| Hang Seng | 0.0 | |
| Nikkei 255 | 0.0 |
📊 Indices Performance Three Months
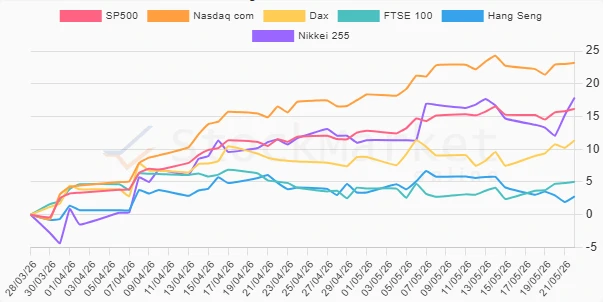
The three-month analysis showcases significant shifts, with Nasdaq com leading the gains at a remarkable 23.21%. The Nikkei 255 and SP500 also depict robust growth, emphasizing strong market recovery or bullish trends in these particular sectors. However, more conservative growth is seen in indices like FTSE 100 and Hang Seng, reflecting regional economic factors.
| Index | Performance (%) | Performance |
|---|---|---|
| Nasdaq com | 23.21 | |
| Nikkei 255 | 17.87 | |
| SP500 | 16.16 | |
| Dax | 11.36 | |
| FTSE 100 | 5.04 | |
| Hang Seng | 2.78 |
✅ Summary
The analysis showcases a clear distinction between static short-term trends and dynamic three-month growth for global indices. While immediate past weeks reveal no change, suggesting possible market consolidation or awaiting macroeconomic clarity, the impressive gains over three months indicate a positive longer-term outlook. Investors should consider market conditions and potential catalysts that could trigger future volatility or sustained growth.
Smart Data Insight
Master the Perfect Entry & Exit for this Stock
Don't leave your profits to chance. Historically, this stock follows specific seasonal patterns that institutional traders use to maximize returns.
- ✅ Identify the "Golden Buying Window"
- ✅ Avoid high-risk correction cycles
- ✅ Backtested data from the last 20+ years