
October 24, 2025 a 12:32 pm



Indices - Performance Analysis
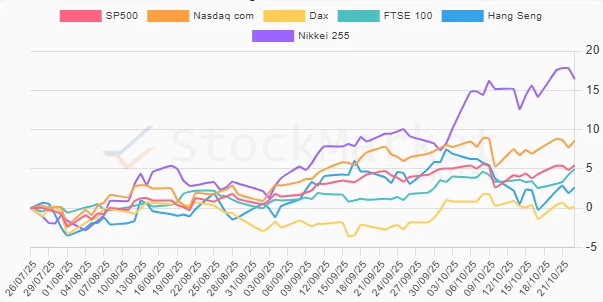
The current assessment of global indices reflects a promising uptrend in the short to medium term, driven primarily by robust performances in Asian markets. A notable standout is the Nikkei 225, overshadowing other indices across all observed time frames. This analysis will explore these dynamics and underlying trends influencing recent market behaviors.
Indices Performance One Week 📊
Over the past week, the Hang Seng Index led the charge with a 2.85% rise, closely followed by the FTSE 100 at 2.37% and the Nikkei 225 rising 2.27%. The DAX and NASDAQ also posted solid gains. These figures suggest a bullish sentiment predominantly swayed by Asian and European markets.
| Index | Performance (%) | Performance |
|---|---|---|
| Hang Seng | 2.85% | |
| FTSE 100 | 2.37% | |
| Nikkei 255 | 2.27% | |
| Dax | 1.58% | |
| Nasdaq com | 1.17% | |
| SP500 | 1.12% |
Indices Performance One Month 📉
The one-month figures offer a diverse snapshot with the Nikkei 225 showing exceptional growth at 6.68%, whereas the Hang Seng fell by 1.95%. The FTSE 100 was strong, posting a 3.51% gain. Generally, gains far exceeded losses, underlining broad positivity in global equity performance.
| Index | Performance (%) | Performance |
|---|---|---|
| Nikkei 255 | 6.68% | |
| FTSE 100 | 3.51% | |
| Dax | 2.33% | |
| Nasdaq com | 2.10% | |
| SP500 | 1.56% | |
| Hang Seng | -1.95% |
Indices Performance Three Months 📈
An extended three-month view shows the Nikkei 225 dominating with a remarkable 16.45% surge, indicating strong economic support in Japan. The Nasdaq also recorded significant gains, whereas the DAX remained mostly flat, illustrating diverse macroeconomic influences.
| Index | Performance (%) | Performance |
|---|---|---|
| Nikkei 255 | 16.45% | |
| Nasdaq com | 8.62% | |
| SP500 | 5.44% | |
| FTSE 100 | 4.94% | |
| Hang Seng | 2.63% | |
| Dax | 0.19% |
Summary ✅
The data reveal robust global market performance predominantly led by Asian indices, particularly the Nikkei 225, which showcased exemplary growth across all periods. This consistent ascent reinforces confidence, likely nudged by favorable economic policies in Asia. Investors may consider bolstering positions in markets mirroring this growth trajectory, capitalizing on both short- and long-term opportunities.
Smart Data Insight
Master the Perfect Entry & Exit for this Stock
Don't leave your profits to chance. Historically, this stock follows specific seasonal patterns that institutional traders use to maximize returns.
- ✅ Identify the "Golden Buying Window"
- ✅ Avoid high-risk correction cycles
- ✅ Backtested data from the last 20+ years