May 22, 2026 a 12:31 pm


Indices - Performance Analysis
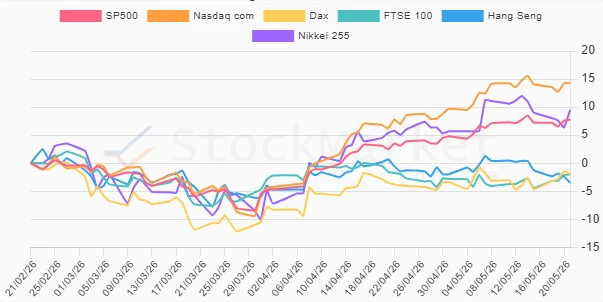
The indices have shown varying performances across different timeframes. This analysis provides insights into one week, one month, and three months performance data, identifying top-performing and underperforming indices, and highlighting key trends and anomalies in the market dynamics. The following trends illustrate market sentiments and potential outlooks for strategic asset allocation.
Indices Performance One Week
| Index | Performance (%) | Performance |
|---|---|---|
| Dax | 2.72% | |
| FTSE 100 | 2.43% | |
| SP500 | 0.51% | |
| Nikkei 255 | 0.50% | |
| Nasdaq com | 0.28% | |
| Hang Seng | -2.23% |
Indices Performance One Month
| Index | Performance (%) | Performance |
|---|---|---|
| Nasdaq com | 6.51% | |
| SP500 | 4.26% | |
| Nikkei 255 | 3.71% | |
| Dax | 1.82% | |
| FTSE 100 | -0.22% | |
| Hang Seng | -2.93% |
Indices Performance Three Months
| Index | Performance (%) | Performance |
|---|---|---|
| Nasdaq com | 14.35% | |
| Nikkei 255 | 9.51% | |
| SP500 | 7.78% | |
| Dax | -1.95% | |
| FTSE 100 | -1.98% | |
| Hang Seng | -3.45% |
Summary
The performance analysis across the varied timeframes indicates a predominantly positive trend, with the Nasdaq consistently outperforming, notably reaching a robust 14.35% over three months. The Hang Seng's persistent underperformance highlights regional challenges, with a substantial negative shift over all examined periods. Investors may consider allocating assets towards higher-performing indices such as the Nasdaq and Nikkei, while remaining cautious in regions experiencing economic uncertainties, such as those associated with the Hang Seng index.
Smart Data Insight
Master the Perfect Entry & Exit for this Stock
Don't leave your profits to chance. Historically, this stock follows specific seasonal patterns that institutional traders use to maximize returns.
- ✅ Identify the "Golden Buying Window"
- ✅ Avoid high-risk correction cycles
- ✅ Backtested data from the last 20+ years