June 20, 2025 a 12:32 pm


Indices - Performance Analysis
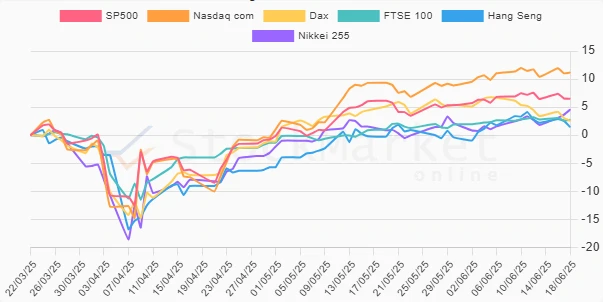
Markets experienced varied dynamics over the past week, month, and quarter, reflecting distinct economic drivers and regional factors. Several indices displayed strong rebounds, while others faced persistent challenges. This analysis delves into the recent performance, identifying key performers and uncovering underlying trends.
Indices Performance One Week 📊
| Index | Performance (%) | Performance |
|---|---|---|
| Nikkei 255 | 2.75 | |
| Nasdaq com | 0.74 | |
| SP500 | 0.07 | |
| FTSE 100 | -0.07 | |
| Hang Seng | -0.76 | |
| Dax | -0.84 |
Indices Performance One Month 📈
| Index | Performance (%) | Performance |
|---|---|---|
| Nikkei 255 | 4.23 | |
| Nasdaq com | 3.60 | |
| SP500 | 2.36 | |
| FTSE 100 | 0.67 | |
| Hang Seng | -0.42 | |
| Dax | -3.34 |
Indices Performance Three Months 📉
| Index | Performance (%) | Performance |
|---|---|---|
| Nasdaq com | 11.15 | |
| SP500 | 6.51 | |
| Nikkei 255 | 4.56 | |
| FTSE 100 | 2.73 | |
| Dax | 2.56 | |
| Hang Seng | 1.44 |
Summary ✅
The analysis highlights regional disparities and sectoral shifts within global markets. The Nasdaq's robust quarterly performance underscores a resurgence in tech investments, outpacing even stable gains seen in indexes like SP500 and Nikkei. The contrasting performance in Hang Seng and Dax indices reflects regional economic challenges and recovery paces. Investors may consider positioning portfolios towards technology sectors while cautiously monitoring geopolitical and economic shifts impacting global markets.
Smart Data Insight
Master the Perfect Entry & Exit for this Stock
Don't leave your profits to chance. Historically, this stock follows specific seasonal patterns that institutional traders use to maximize returns.
- ✅ Identify the "Golden Buying Window"
- ✅ Avoid high-risk correction cycles
- ✅ Backtested data from the last 20+ years