
February 20, 2026 a 12:32 pm


Indices - Performance Analysis
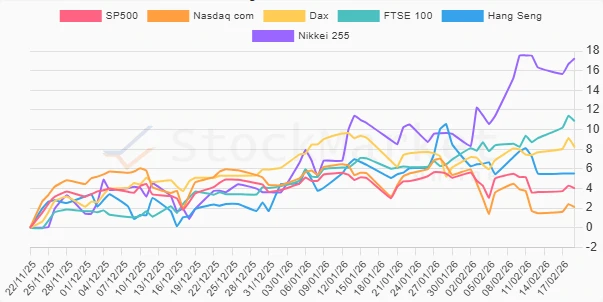
In the landscape of global financial markets, indices play a pivotal role in providing a snapshot of market performance. This analysis delves into the recent movements across major indices over one week, one month, and three months. By examining these periods, we can identify market trends, highlight top performers, and recognize underperformers to provide a comprehensive market view.
Indices Performance One Week 📊
| Index | Performance (%) | Performance |
|---|---|---|
| FTSE 100 | 1.73 | |
| Nikkei 255 | 0.93 | |
| Nasdaq com | 0.61 | |
| Dax | 0.53 | |
| SP500 | 0.38 | |
| Hang Seng | 0.00 |
Indices Performance One Month 📊
| Index | Performance (%) | Performance |
|---|---|---|
| Nikkei 255 | 8.75 | |
| FTSE 100 | 4.74 | |
| Dax | 2.00 | |
| Hang Seng | 0.08 | |
| SP500 | -0.16 | |
| Nasdaq com | -2.24 |
Indices Performance Three Months 📊
| Index | Performance (%) | Performance |
|---|---|---|
| Nikkei 255 | 17.25 | |
| FTSE 100 | 10.86 | |
| Dax | 8.21 | |
| Hang Seng | 5.52 | |
| SP500 | 4.01 | |
| Nasdaq com | 2.10 |
Summary 💡
The recent analysis of index performances highlights distinct regional and temporal trends. Over one week, the FTSE 100 led the charge despite the muted growth of the Hang Seng Index. The one-month review reflects a significant ascent of the Nikkei 255, while the Nasdaq com showed notable declines. Over the three-month span, positive momentum continues with the Nikkei 255 and FTSE 100 leading the gains, leveraging regional economic dynamics and investor sentiment. Investors should remain vigilant, however, as market volatility continues to pose potential risks and opportunities.
Smart Data Insight
Master the Perfect Entry & Exit for this Stock
Don't leave your profits to chance. Historically, this stock follows specific seasonal patterns that institutional traders use to maximize returns.
- ✅ Identify the "Golden Buying Window"
- ✅ Avoid high-risk correction cycles
- ✅ Backtested data from the last 20+ years