
June 19, 2026 a 12:31 pm

Indices - Performance Analysis
In recent periods, the global indices have shown varied performances across different timeframes. The initial data indicates some positive trends over the month and quarter, despite stable performance in the past week. This analysis aims to delve deeper into the performance indicators of major indices to identify patterns and trends.
📊 Indices Performance One Week
Over the past week, major indices displayed no remarkable movement, maintaining stability across the board. This stagnation period suggests a wait-and-see approach in the markets, potentially impacted by upcoming economic data releases and global events.
| Index | Performance (%) | Performance |
|---|---|---|
| SP500 | 0.00% | |
| Nasdaq com | 0.00% | |
| Dax | 0.00% | |
| FTSE 100 | 0.00% | |
| Hang Seng | 0.00% | |
| Nikkei 255 | 0.00% |
📊 Indices Performance One Month
The monthly performance data reflect a period of recovery and growth for several indices, with the Nikkei 255 standing out as the top performer, while the Hang Seng faced a slight decrease. This mixed performance highlights the varying macroeconomic pressures and sectoral performances globally.
| Index | Performance (%) | Performance |
|---|---|---|
| Nikkei 255 | 5.82% | |
| Dax | 2.00% | |
| Nasdaq com | 1.82% | |
| SP500 | 1.62% | |
| FTSE 100 | 1.31% | |
| Hang Seng | -0.17% |
📊 Indices Performance Three Months
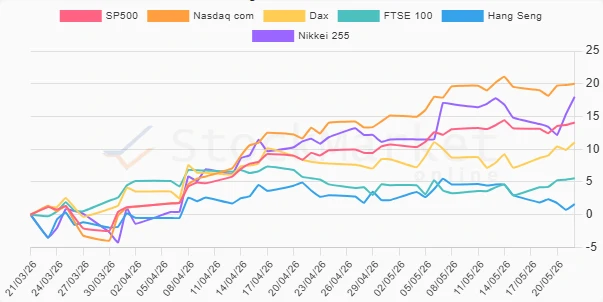
Over the last quarter, technology-driven markets like Nasdaq and Nikkei have shown significant growth, showcasing investor confidence in these sectors. The SP500 and Dax also registered substantial gains, indicating a broad-based positive sentiment among global economies.
| Index | Performance (%) | Performance |
|---|---|---|
| Nasdaq com | 19.99% | |
| Nikkei 255 | 17.99% | |
| SP500 | 14.07% | |
| Dax | 11.04% | |
| FTSE 100 | 5.56% | |
| Hang Seng | 1.61% |
📈 Summary
Analyzing the recent performance data over various timeframes, it is evident that growth-oriented markets, primarily driven by technology, have been leading the index gains. The consistent uptrend in these indices suggests robust investor confidence and a potential for sustained growth. It is advisable for investors to monitor macroeconomic indicators and sectoral trends vigilantly, as they could significantly influence asset values moving forward.
Smart Data Insight
Master the Perfect Entry & Exit for this Stock
Don't leave your profits to chance. Historically, this stock follows specific seasonal patterns that institutional traders use to maximize returns.
- ✅ Identify the "Golden Buying Window"
- ✅ Avoid high-risk correction cycles
- ✅ Backtested data from the last 20+ years