April 17, 2026 a 12:31 pm


Indices - Performance Analysis
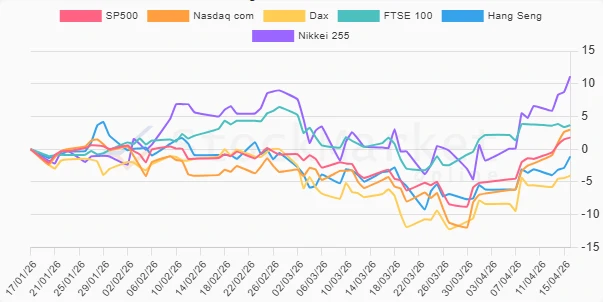
In the recent performance review of major indices, we observe mixed results across different time frames. The Nasdaq has consistently displayed robust upward momentum, while other indices have displayed varying degrees of strength and weakness. Notably, the Nikkei 255 demonstrates exceptional performance over the past three months, signifying resilience and strong economic indicators from the Asian markets.
Indices Performance One Week 📈
| Index | Performance (%) | Performance |
|---|---|---|
| Nasdaq com | 5.14% | |
| Nikkei 255 | 4.51% | |
| SP500 | 3.26% | |
| Hang Seng | 1.93% | |
| Dax | 1.46% | |
| FTSE 100 | -0.10% |
Indices Performance One Month 📊
| Index | Performance (%) | Performance |
|---|---|---|
| Nasdaq com | 8.69% | |
| Nikkei 255 | 8.08% | |
| SP500 | 6.27% | |
| Dax | 3.03% | |
| FTSE 100 | 2.85% | |
| Hang Seng | 1.64% |
Indices Performance Three Months 🔍
| Index | Performance (%) | Performance |
|---|---|---|
| Nikkei 255 | 11.12% | |
| FTSE 100 | 3.67% | |
| Nasdaq com | 2.98% | |
| SP500 | 1.77% | |
| Hang Seng | -1.13% | |
| Dax | -4.06% |
Summary 💡
Across the reviewed periods, the Nasdaq and Nikkei 255 have outperformed other indices, presenting promising growth trajectories. The consistent upward movement in the Nikkei 255 over three months highlights strong performance from Japan's market entities. Conversely, the Dax's decline over the same period indicates undercurrents of economic challenges within Europe. Investors should adopt a cautious yet strategic approach, focusing potential investments in robustly performing indices while monitoring global economic developments.
Smart Data Insight
Master the Perfect Entry & Exit for this Stock
Don't leave your profits to chance. Historically, this stock follows specific seasonal patterns that institutional traders use to maximize returns.
- ✅ Identify the "Golden Buying Window"
- ✅ Avoid high-risk correction cycles
- ✅ Backtested data from the last 20+ years