May 15, 2026 a 12:32 pm


Indices - Performance Analysis
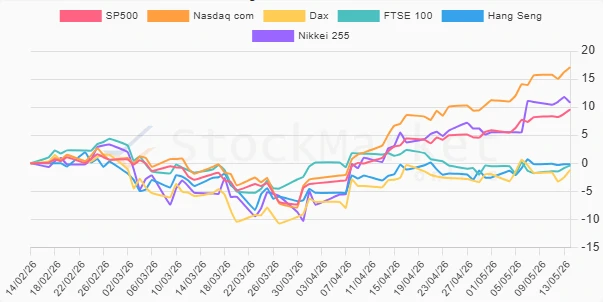
This comprehensive performance analysis examines the movements of major indices across three distinct periods: 1 Week, 1 Month, and 3 Months. The analysis will highlight top performers, evaluate trends, and provide thoughtful insights on market dynamics during these timeframes. Through a detailed assessment, investors can gain a better understanding of recent market developments and leverage this knowledge for informed decision-making.
Indices Performance One Week 📊
| Index | Performance (%) | Performance |
|---|---|---|
| Nasdaq com | 1.47 | |
| SP500 | 1.38 | |
| FTSE 100 | 1.36 | |
| Dax | 0.51 | |
| Hang Seng | -0.02 | |
| Nikkei 255 | -0.09 |
Indices Performance One Month 📈
| Index | Performance (%) | Performance |
|---|---|---|
| Nasdaq com | 10.44 | |
| Nikkei 255 | 7.72 | |
| SP500 | 6.63 | |
| Hang Seng | 1.78 | |
| Dax | 1.74 | |
| FTSE 100 | -1.73 |
Indices Performance Three Months 📉
| Index | Performance (%) | Performance |
|---|---|---|
| Nasdaq com | 17.12 | |
| Nikkei 255 | 10.81 | |
| SP500 | 9.58 | |
| FTSE 100 | -0.41 | |
| Hang Seng | -0.18 | |
| Dax | -1.20 |
Summary 📢
The performance analysis across weekly, monthly, and quarterly timeframes reveals a consistent strength for technology-heavy indices such as Nasdaq, which has led over all periods examined. Meanwhile, despite some evident gains, certain indices like FTSE 100 and DAX have struggled, notably over the longer term. Strategic investors should remain vigilant of these trends, particularly for potential adjustments in their portfolios. The strong performance of the Nasdaq underscores the buoyancy in technology and growth-oriented sectors, warranting a continued watch for opportunities and potential recalibrations to align with market trends.
Smart Data Insight
Master the Perfect Entry & Exit for this Stock
Don't leave your profits to chance. Historically, this stock follows specific seasonal patterns that institutional traders use to maximize returns.
- ✅ Identify the "Golden Buying Window"
- ✅ Avoid high-risk correction cycles
- ✅ Backtested data from the last 20+ years