November 14, 2025 a 12:32 pm


Indices - Performance Analysis
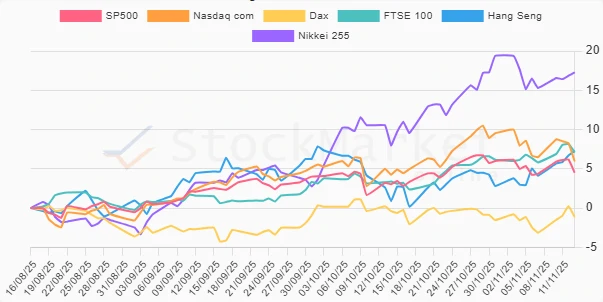
As global economies continue to navigate post-pandemic challenges, indices have shown varying degrees of resilience across different time frames. Our analysis delves into the latest data, scrutinizing short-term fluctuations over one week, through to medium and longer-term trends spanning three months. This comprehensive evaluation will provide critical insights into market dynamics, identifying which indices are gracing new peaks and which face ongoing hurdles.
Indices Performance One Week 📊
| Index | Performance (%) | Performance |
|---|---|---|
| Hang Seng | 3.14 | |
| Dax | 2.01 | |
| Nikkei 255 | 1.98 | |
| FTSE 100 | 1.30 | |
| SP500 | 0.15 | |
| Nasdaq com | -0.53 |
Indices Performance One Month 📉
| Index | Performance (%) | Performance |
|---|---|---|
| Nikkei 255 | 7.55 | |
| Hang Seng | 4.52 | |
| FTSE 100 | 4.02 | |
| SP500 | 1.07 | |
| Nasdaq com | 1.05 | |
| Dax | -0.50 |
Indices Performance Three Months 🔍
| Index | Performance (%) | Performance |
|---|---|---|
| Nikkei 255 | 17.28 | |
| Hang Seng | 7.27 | |
| FTSE 100 | 7.12 | |
| Nasdaq com | 5.96 | |
| SP500 | 4.52 | |
| Dax | -1.12 |
Summary ✅
Overall, the Nikkei 255 has demonstrated remarkable growth across all observed timeframes, establishing itself as a consistent outperformer in the market. In contrast, the Dax has faced challenges, underperforming relative to its peers. The resilience showcased by the Asian markets, particularly the Hang Seng and Nikkei, highlights a regional trend towards recovery and growth. In light of these assessments, investors should consider diversifying portfolios towards strong-performing regions while maintaining vigilance on European markets amidst evident economic headwinds.
Smart Data Insight
Master the Perfect Entry & Exit for this Stock
Don't leave your profits to chance. Historically, this stock follows specific seasonal patterns that institutional traders use to maximize returns.
- ✅ Identify the "Golden Buying Window"
- ✅ Avoid high-risk correction cycles
- ✅ Backtested data from the last 20+ years