March 13, 2026 a 12:32 pm


Indices - Performance Analysis
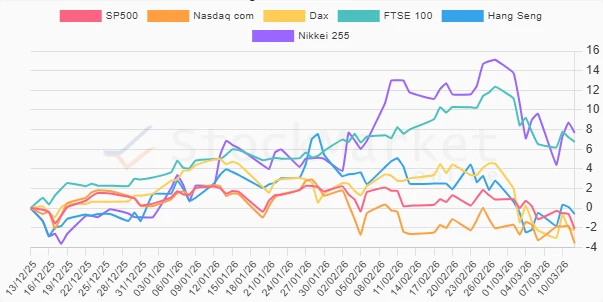
Observing the market dynamics over the past few periods reveals considerable volatility across major indices. Weekly performance varied significantly, while monthly assessments indicated broader market weaknesses. Over a trimester, however, certain indices exhibited resilience and potential upward trends, adding optimism to long-term outlooks.
📊 Indices Performance One Week
The weekly performance shows a mixed bag with the Nikkei 225 struggling, while the FTSE 100 managed modest gains. The week's fluctuations mirror immediate market reactions and emerging challenges.
| Index | Performance (%) | Performance |
|---|---|---|
| FTSE 100 | 0.22 | |
| Dax | 0.04 | |
| Nasdaq com | -0.31 | |
| Hang Seng | -0.12 | |
| SP500 | -0.98 | |
| Nikkei 255 | -1.93 |
📊 Indices Performance One Month
Over the month, the indices consistently showed declines, with the Hang Seng experiencing the steepest drop. The overall downtrend reflects macroeconomic pressures and investor sentiment shifts.
| Index | Performance (%) | Performance |
|---|---|---|
| FTSE 100 | -1.50 | |
| Nasdaq com | -3.20 | |
| SP500 | -3.87 | |
| Nikkei 255 | -5.33 | |
| Dax | -5.02 | |
| Hang Seng | -5.67 |
📊 Indices Performance Three Months
In the quarter view, the Nikkei 225 and FTSE 100 emerged as leaders, suggesting recovery and growth potential. This indicates a positive longer-term outlook amidst fluctuating market conditions.
| Index | Performance (%) | Performance |
|---|---|---|
| Nikkei 255 | 7.68 | |
| FTSE 100 | 6.75 | |
| Hang Seng | -0.59 | |
| Dax | -2.23 | |
| SP500 | -2.11 | |
| Nasdaq com | -3.58 |
🔍 Summary
The quarterly success of the Nikkei 225 and FTSE 100 stands out as promising, while the broader monthly downturn underscores existing economic challenges. A strategic approach focusing on resilient regions and sectors may yield advantageous positioning in anticipation of market adjustments.
Smart Data Insight
Master the Perfect Entry & Exit for this Stock
Don't leave your profits to chance. Historically, this stock follows specific seasonal patterns that institutional traders use to maximize returns.
- ✅ Identify the "Golden Buying Window"
- ✅ Avoid high-risk correction cycles
- ✅ Backtested data from the last 20+ years