February 13, 2026 a 12:32 pm


Indices - Performance Analysis
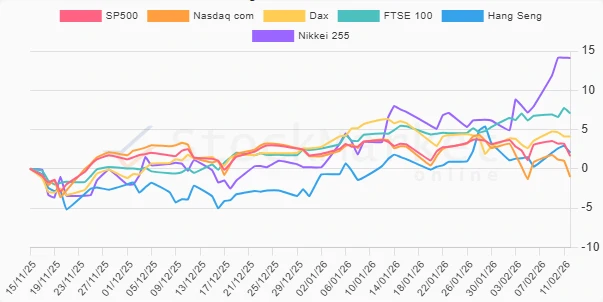
📊 The current analysis provides a detailed examination of index performances over different periods. By investigating short-term (1W), medium-term (1M), and long-term (3M) timelines, we identify emerging trends and significant movements. This assessment targets market positioning, revealing both robust gainers and lagging performers across global indices.
Indices Performance One Week
| Index | Performance (%) | Performance |
|---|---|---|
| Nikkei 255 | 6.15 | |
| Hang Seng | 1.79 | |
| Dax | 0.54 | |
| FTSE 100 | 0.32 | |
| SP500 | -1.44 | |
| Nasdaq com | -1.88 |
🔍 In the one-week performance analysis, the Nikkei 255 emerges as the top performer, driven by favorable market conditions in Asia, while US indices show weaknesses...
Indices Performance One Month
| Index | Performance (%) | Performance |
|---|---|---|
| Nikkei 255 | 6.12 | |
| FTSE 100 | 2.14 | |
| Hang Seng | 0.26 | |
| SP500 | -1.29 | |
| Dax | -1.69 | |
| Nasdaq com | -3.65 |
📉 The one-month analysis highlights the Nikkei 255 continuing its upward trajectory. However, the Nasdaq com reflects persistent bearish trends due to technology sector volatility...
Indices Performance Three Months
| Index | Performance (%) | Performance |
|---|---|---|
| Nikkei 255 | 14.12 | |
| FTSE 100 | 7.07 | |
| Dax | 4.11 | |
| Hang Seng | 2.07 | |
| SP500 | 1.63 | |
| Nasdaq com | -1.02 |
📈 Over the three-month period, the Nikkei 255 solidifies its lead as top performer, breaking barriers with a notable 14.12% gain, while European markets also show significant resilience...
Summary
💡 In conclusion, the indices analysis underscores the prevailing strength of the Nikkei 255 across all terms, evidencing stable growth in Asian markets. On the other hand, US indices, particularly the Nasdaq com, highlight volatility and challenges in the tech sector. Investors should exercise strategic discretion, considering regional economic signals and sector trends to optimize their portfolios.
Smart Data Insight
Master the Perfect Entry & Exit for this Stock
Don't leave your profits to chance. Historically, this stock follows specific seasonal patterns that institutional traders use to maximize returns.
- ✅ Identify the "Golden Buying Window"
- ✅ Avoid high-risk correction cycles
- ✅ Backtested data from the last 20+ years