September 12, 2025 a 12:31 pm


Indices - Performance Analysis
Analyzing the performance of significant global indices over various time frames reveals critical insights into market trends. The analysis delivers an authoritative view of the short to medium-term momentum across different markets, allowing for informed investment decisions. Through a meticulous breakdown, investors can identify both opportunities and risks in this dynamic environment.
📊 Indices Performance One Week
| Index | Performance (%) | Performance |
|---|---|---|
| Nikkei 255 | 3.12% | |
| Hang Seng | 2.62% | |
| SP500 | 1.63% | |
| Nasdaq com | 1.57% | |
| FTSE 100 | 0.96% | |
| Dax | 0.46% |
📊 Indices Performance One Month
| Index | Performance (%) | Performance |
|---|---|---|
| Nikkei 255 | 2.60% | |
| SP500 | 1.88% | |
| Hang Seng | 1.94% | |
| FTSE 100 | 1.44% | |
| Nasdaq com | 1.56% | |
| Dax | -1.95% |
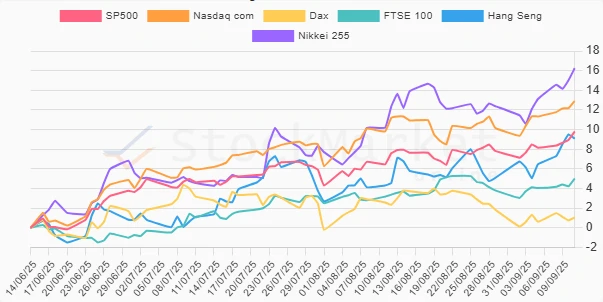
📊 Indices Performance Three Months
| Index | Performance (%) | Performance |
|---|---|---|
| Nikkei 255 | 16.24% | |
| Nasdaq com | 12.90% | |
| SP500 | 9.79% | |
| Hang Seng | 9.08% | |
| FTSE 100 | 5.00% | |
| Dax | 1.06% |
📈 Summary
The analysis of these indices over various time frames highlights the robust performance of the Nikkei 255, particularly over three months, showcasing strong market momentum in Japan. Meanwhile, the Nasdaq exhibits impressive growth, reflective of a resilient tech sector. Caution is advised regarding the Dax, which shows negative performance over one month, indicating potential regional or sector-specific pressures. Investors should closely monitor these trends and adjust strategies accordingly to capitalize on market opportunities while mitigating risks.
Smart Data Insight
Master the Perfect Entry & Exit for this Stock
Don't leave your profits to chance. Historically, this stock follows specific seasonal patterns that institutional traders use to maximize returns.
- ✅ Identify the "Golden Buying Window"
- ✅ Avoid high-risk correction cycles
- ✅ Backtested data from the last 20+ years