
June 12, 2026 a 12:32 pm


Indices - Performance Analysis
In this comprehensive analysis, we explore the performance of major indices over the past week, month, and three months. Leveraging structured data, we aim to identify key trends and potential investment opportunities, as well as underline risks that investors should be aware of. This analysis intends to provide a clear perspective on market dynamics.
Indices Performance One Week 📊
During the last week, major indices displayed a flat performance across the board. In a period marked by stability, cautious investor sentiment and geopolitical factors seem to have resulted in no movement. The absence of fluctuations indicates a wait-and-see approach prevalent in the markets, offering little insight into momentum or direction at this time.
| Index | Performance (%) | Performance |
|---|---|---|
| SP500 | 0.00% | |
| Nasdaq com | 0.00% | |
| Dax | 0.00% | |
| FTSE 100 | 0.00% | |
| Hang Seng | 0.00% | |
| Nikkei 255 | 0.00% |
Indices Performance One Month 📊
Over the last month, the Dax outperformed with a notable increase of 3.88%, signaling a possible positive investor sentiment towards European markets. Meanwhile, the Hang Seng lagged with a decrease of -2.99%, reflecting regional economic challenges. These distinctions underscore varying market conditions across global economies and indices, pointing towards Europe gaining traction amidst broader market recoveries.
| Index | Performance (%) | Performance |
|---|---|---|
| Dax | 3.88% | |
| FTSE 100 | 1.98% | |
| Nasdaq com | 1.01% | |
| SP500 | 0.99% | |
| Nikkei 255 | 0.21% | |
| Hang Seng | -2.99% |
Indices Performance Three Months 📊
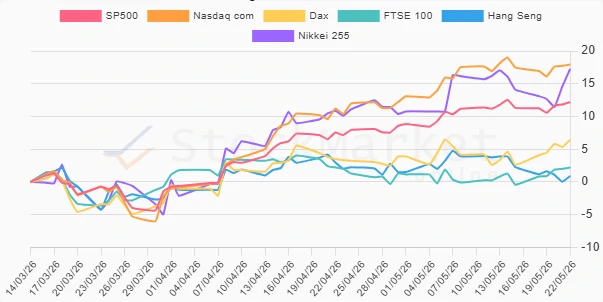
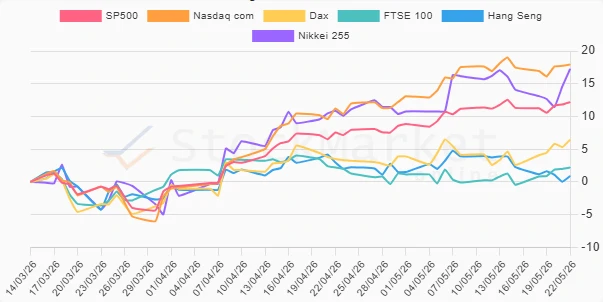
The past three months reveal a robust bullish trend, especially for the Nasdaq with a notable 17.93% increase, outperforming others significantly. Tech-heavy indices like the Nasdaq and Nikkei appear to capitalize on recent technological sector momentum, reflecting investor optimism in these sectors. Overall, global markets show resilience with positive performances, driven by economic recovery signals and investor confidence.
| Index | Performance (%) | Performance |
|---|---|---|
| Nasdaq com | 17.93% | |
| Nikkei 255 | 17.26% | |
| SP500 | 12.19% | |
| Dax | 6.46% | |
| FTSE 100 | 2.21% | |
| Hang Seng | 0.90% |
Summary 🔍
Overall, the analysis illustrates contrasting performances across different periods. Short-term stability is evident, whereas medium and longer-term data show considerable dynamism especially within tech-heavy indices. Investors should remain vigilant, balancing potential gains observed in recent months against ongoing global uncertainties. Evaluating individual market conditions is paramount for strategic positioning.
Smart Data Insight
Master the Perfect Entry & Exit for this Stock
Don't leave your profits to chance. Historically, this stock follows specific seasonal patterns that institutional traders use to maximize returns.
- ✅ Identify the "Golden Buying Window"
- ✅ Avoid high-risk correction cycles
- ✅ Backtested data from the last 20+ years