April 10, 2026 a 12:32 pm


Indices - Performance Analysis
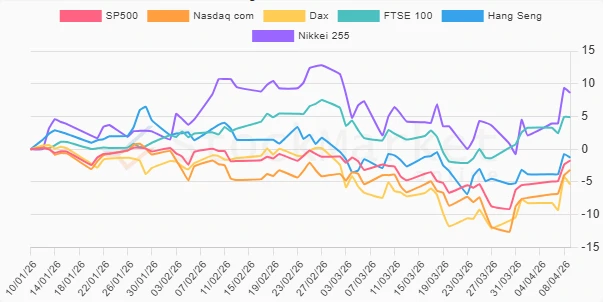
Recent performance across major global indices shows a diverse range of outcomes over different time horizons. A prominent rebound is observed in short-term measures, while medium-term perspectives signal differentiated regional indices trajectories. These shifts highlight shifting market dynamics and evolving risk appetites.
Indices Performance One Week 📊
| Index | Performance (%) | Performance |
|---|---|---|
| Nikkei 255 | 5.24 | |
| Nasdaq com | 4.27 | |
| SP500 | 3.65 | |
| Dax | 2.86 | |
| Hang Seng | 2.55 | |
| FTSE 100 | 1.62 |
Indices Performance One Month 📊
| Index | Performance (%) | Performance |
|---|---|---|
| FTSE 100 | 2.52 | |
| Nikkei 255 | 2.18 | |
| Dax | 1.02 | |
| SP500 | 0.89 | |
| Nasdaq com | 0.72 | |
| Hang Seng | -0.33 |
Indices Performance Three Months 📊
| Index | Performance (%) | Performance |
|---|---|---|
| Nikkei 255 | 8.61 | |
| FTSE 100 | 4.89 | |
| Hang Seng | -1.28 | |
| SP500 | -1.74 | |
| Nasdaq com | -3.16 | |
| Dax | -5.37 |
Summary 🔍
Evaluating the diverse performances over the past week, month, and quarter, the Nikkei 255 emerges as a consistent leader, showcasing considerable resilience and growth, especially over three months. Conversely, the Dax has struggled in the same trimestral period, indicating regional challenges. The FTSE 100 has made notable gains, contrasting with the Nasdaq's mild decline. Overall, the performance data reflects a dynamic economic environment with distinct regional influences, underlying the importance of diversified portfolio strategies.
Smart Data Insight
Master the Perfect Entry & Exit for this Stock
Don't leave your profits to chance. Historically, this stock follows specific seasonal patterns that institutional traders use to maximize returns.
- ✅ Identify the "Golden Buying Window"
- ✅ Avoid high-risk correction cycles
- ✅ Backtested data from the last 20+ years