February 06, 2026 a 12:32 pm


Indices - Performance Analysis
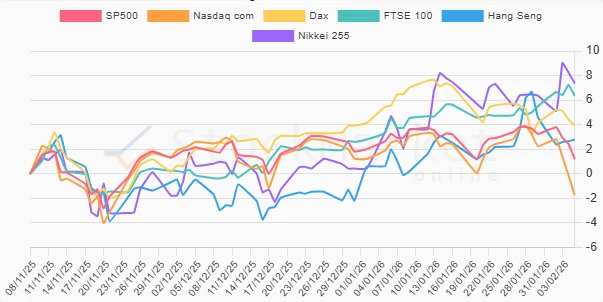
The recent analysis of global indices reveals notable divergence in performance across various time frames. While some indices have shown resilience and growth, others have grappled with downturns, reflecting the complex interplay of global economic factors. This assessment aims to illuminate these dynamics, providing investors with a clearer understanding of market trends and potential future movements.
📊 Indices Performance One Week
| Index | Performance (%) | Performance |
|---|---|---|
| Nikkei 255 | 1.01% | |
| FTSE 100 | 0.84% | |
| Dax | -0.20% | |
| Hang Seng | -1.82% | |
| SP500 | -2.04% | |
| Nasdaq com | -3.97% |
📈 Indices Performance One Month
| Index | Performance (%) | Performance |
|---|---|---|
| Nikkei 255 | 3.72% | |
| FTSE 100 | 2.58% | |
| Hang Seng | 1.73% | |
| SP500 | -1.72% | |
| Dax | -2.52% | |
| Nasdaq com | -4.42% |
📉 Indices Performance Three Months
| Index | Performance (%) | Performance |
|---|---|---|
| Nikkei 255 | 7.37% | |
| FTSE 100 | 6.35% | |
| Dax | 3.95% | |
| Hang Seng | 2.78% | |
| SP500 | 1.20% | |
| Nasdaq com | -1.72% |
🔍 Summary
Over the span of three months, the Nikkei 255 emerges as a top performer, reflecting robust economic indicators in Japan. Meanwhile, the Nasdaq com has consistently underperformed across all timeframes, indicating challenges within the tech sector. The FTSE 100 also shows promising gains, especially when compared to other European indices, pointing to investor confidence in the UK market. Overall, this analysis highlights the importance of geographical and sector diversification to mitigate risks and capitalize on growth opportunities.
Smart Data Insight
Master the Perfect Entry & Exit for this Stock
Don't leave your profits to chance. Historically, this stock follows specific seasonal patterns that institutional traders use to maximize returns.
- ✅ Identify the "Golden Buying Window"
- ✅ Avoid high-risk correction cycles
- ✅ Backtested data from the last 20+ years