September 05, 2025 a 12:32 pm


Indices - Performance Analysis
📊 This analysis provides a comprehensive view on the performance of major indices over short to medium time frames, highlighting key trends and shifts. Our examination covers three periods: 1 week, 1 month, and 3 months, showcasing both the strengths and weaknesses across these global benchmarks.
Indices Performance One Week (1W)
| Index | Performance (%) | Performance |
|---|---|---|
| Nasdaq com | 1.18 | |
| SP500 | 0.65 | |
| FTSE 100 | 0.32 | |
| Hang Seng | -0.04 | |
| Nikkei 255 | -0.30 | |
| Dax | -0.52 |
Indices Performance One Month (1M)
| Index | Performance (%) | Performance |
|---|---|---|
| Nikkei 255 | 4.40 | |
| Nasdaq com | 2.58 | |
| SP500 | 2.47 | |
| Hang Seng | 0.71 | |
| FTSE 100 | 0.58 | |
| Dax | -0.58 |
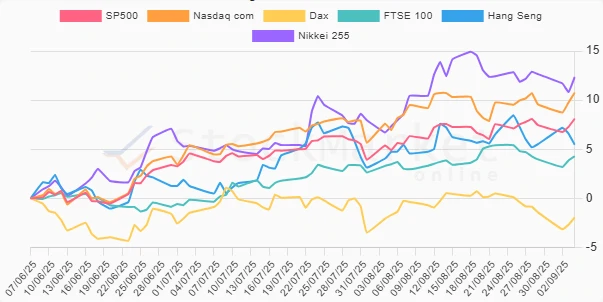
Indices Performance Three Months (3M)
| Index | Performance (%) | Performance |
|---|---|---|
| Nikkei 255 | 12.34 | |
| Nasdaq com | 10.74 | |
| SP500 | 8.10 | |
| Hang Seng | 5.47 | |
| FTSE 100 | 4.28 | |
| Dax | -1.95 |
Summary
💡 The performance of indices over varying periods illustrates the dynamics at play in the financial markets. The Nikkei 255 showed significant strength, especially in the medium-term view. The Nasdaq Composite was a consistent top performer over both short and long durations. In contrast, the DAX struggled across all periods, indicating regional economic pressures or sector-specific issues. Notably, the broader stability in the SP500 across different timeframes signals resilience. Strategic investments should consider these trends to capture upward momentum while being wary of persistent underperformance risks.
Smart Data Insight
Master the Perfect Entry & Exit for this Stock
Don't leave your profits to chance. Historically, this stock follows specific seasonal patterns that institutional traders use to maximize returns.
- ✅ Identify the "Golden Buying Window"
- ✅ Avoid high-risk correction cycles
- ✅ Backtested data from the last 20+ years