June 05, 2026 a 12:32 pm


Indices - Performance Analysis
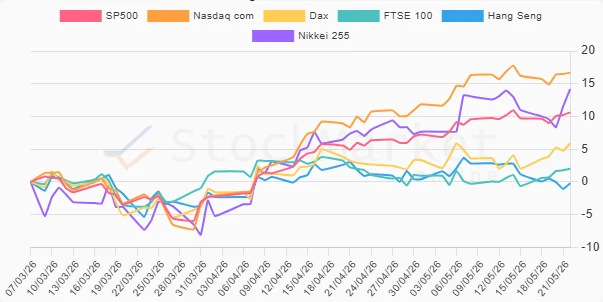
In the past quarter, global indices have exhibited varied performance, reflecting the complex economic landscape. The Nasdaq Composite has led the rally, followed by a strong performance from the Nikkei 255, suggesting an investor preference for technology and Asian markets. Meanwhile, the Hang Seng has faced headwinds over the last month, showing the impact of geopolitical challenges.
📊 Indices Performance One Week
The one-week performance for major indices has remained flat across the board. This period represents a stabilization phase, with no index showing either gains or losses. This calmness could signal a looming transition or consolidation phase in the market.
| Index | Performance (%) | Performance |
|---|---|---|
| SP500 | 0.00% | |
| Nasdaq com | 0.00% | |
| Dax | 0.00% | |
| FTSE 100 | 0.00% | |
| Hang Seng | 0.00% | |
| Nikkei 255 | 0.00% |
📊 Indices Performance One Month
Over the past month, the indices demonstrated noticeable movements, with the Nikkei 255 emerging as the top performer, gaining 6.49%. The Nasdaq Composite also showed robust gains, reflecting investors' confidence in tech-driven growth. In contrast, the Hang Seng Index struggled, declining by 2.31%, underscoring challenges in the Hong Kong market.
| Index | Performance (%) | Performance |
|---|---|---|
| Nikkei 255 | 6.49% | |
| Nasdaq com | 4.00% | |
| FTSE 100 | 2.46% | |
| SP500 | 2.94% | |
| Dax | 2.09% | |
| Hang Seng | -2.31% |
📊 Indices Performance Three Months
The three-month analysis reveals significant upward trends, especially in tech-centric indices. Nasdaq emerges as a dominant force with a 16.69% gain, underscoring the tech sector's resilience. The Nikkei 255 also displays strong performance, followed closely by SP500. The Hang Seng reflects minor losses, illustrating persistent regional pressures.
| Index | Performance (%) | Performance |
|---|---|---|
| Nasdaq com | 16.69% | |
| Nikkei 255 | 14.17% | |
| SP500 | 10.60% | |
| Dax | 5.90% | |
| FTSE 100 | 2.00% | |
| Hang Seng | -0.20% |
💡 Summary
Overall, the indices demonstrate a strong performance over the quarter, with technology-focused indices like the Nasdaq and geographical regions such as Japan showing considerable growth. While short-term stability is evident, particularly in the one-week performance, the longer-term view highlights the strengths and weaknesses across different regions and sectors. Investors could consider a diversified approach, capitalizing on tech's resilience and caution with regions facing geopolitical challenges.
Smart Data Insight
Master the Perfect Entry & Exit for this Stock
Don't leave your profits to chance. Historically, this stock follows specific seasonal patterns that institutional traders use to maximize returns.
- ✅ Identify the "Golden Buying Window"
- ✅ Avoid high-risk correction cycles
- ✅ Backtested data from the last 20+ years