
July 03, 2026 a 12:31 pm

Indices - Performance Analysis
📊 Over recent weeks, the global indices have demonstrated varied performance. While short-term changes seem negligible, the longer-term trends reveal significant shifts, particularly for tech-focused indices. This analysis provides a detailed review, showcasing both stability in the short term and dynamic growth potential in the quarter view.
Indices Performance One Week
🗣️ Over the past week, the major indices have shown no significant movement. Stability is a key highlight here, with all indices reporting zero percent change, indicating a period of consolidation or market pause.
| Index | Performance (%) | Performance |
|---|---|---|
| SP500 | 0.0% | |
| Nasdaq com | 0.0% | |
| Dax | 0.0% | |
| FTSE 100 | 0.0% | |
| Hang Seng | 0.0% | |
| Nikkei 255 | 0.0% |
Indices Performance One Month
🔍 Similar to the weekly performance, the monthly results reflect a stagnant phase with zero percent change across all major indices. This uniformity suggests market stability or potentially a waiting period for decisive market-moving data or events.
| Index | Performance (%) | Performance |
|---|---|---|
| SP500 | 0.0% | |
| Nasdaq com | 0.0% | |
| Dax | 0.0% | |
| FTSE 100 | 0.0% | |
| Hang Seng | 0.0% | |
| Nikkei 255 | 0.0% |
Indices Performance Three Months
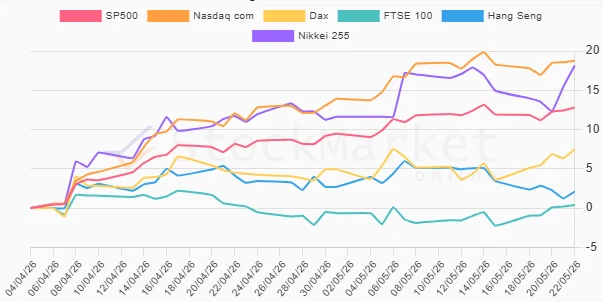
📈 On a quarterly basis, the performance of indices shows significant growth, especially in technology-focused markets. The Nasdaq leads with an impressive 18.77% gain, closely followed by the Nikkei at 18.12%. This highlights an overall positive trend in those markets, potentially driven by a robust tech sector rebound.
| Index | Performance (%) | Performance |
|---|---|---|
| Nasdaq com | 18.77% | |
| Nikkei 255 | 18.12% | |
| SP500 | 12.81% | |
| Dax | 7.49% | |
| Hang Seng | 2.10% | |
| FTSE 100 | 0.41% |
Summary
💡 In conclusion, while short-term performance indicators show stabilization, substantial growth in the last quarter, especially in technology sectors, reaffirms optimism in market momentum. Investors may consider maintaining a balanced portfolio approach, leveraging both tech growth potentials and the stability of well-established markets.
Smart Data Insight
Master the Perfect Entry & Exit for this Stock
Don't leave your profits to chance. Historically, this stock follows specific seasonal patterns that institutional traders use to maximize returns.
- ✅ Identify the "Golden Buying Window"
- ✅ Avoid high-risk correction cycles
- ✅ Backtested data from the last 20+ years