
January 02, 2026 a 12:31 pm


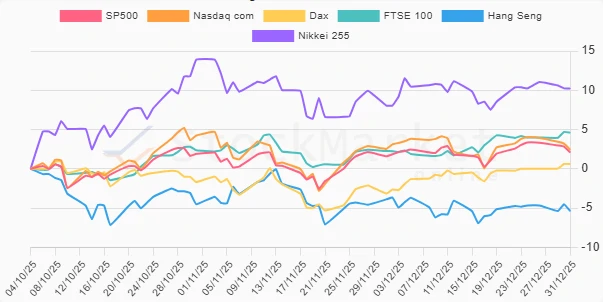

Indices - Performance Analysis
📊 The latest analysis of global indices over three distinct periods reveals insightful trends and potential investment signals. The short-term showed mixed performances, while the long-term analysis highlights significant growth in selective markets. Attention should be placed on identifying whether these trends are forms of cyclical corrections or indicative of broader economic transformations.
Indices Performance One Week
The one-week performance showcased volatility, with European markets showing slight gains, while major US and Asian indices experienced declines. Dax and FTSE 100 were the top short-term performers, signaling possible regional economic resilience.
| Index | Performance (%) | Performance |
|---|---|---|
| Dax | 0.62% | |
| FTSE 100 | 0.62% | |
| Hang Seng | -0.72% | |
| Nikkei 255 | -0.81% | |
| SP500 | -1.23% | |
| Nasdaq com | -1.50% |
Indices Performance One Month
Over the month, positive growth was primarily seen in European and Japanese markets, with the Dax leading. Although US indices showed minor declines, the overall market sentiment remains cautiously optimistic.
| Index | Performance (%) | Performance |
|---|---|---|
| Dax | 3.33% | |
| FTSE 100 | 2.46% | |
| Nikkei 255 | 1.05% | |
| SP500 | -0.05% | |
| Hang Seng | -0.45% | |
| Nasdaq com | -0.85% |
Indices Performance Three Months
The three-month overview presents a robust recovery, particularly notable in the Nikkei 255 and FTSE 100, pointing toward strategic gains in both regions. Despite a significant downturn in the Hang Seng index, other indices reflect generally positive trajectories, signaling potential investment opportunities.
| Index | Performance (%) | Performance |
|---|---|---|
| Nikkei 255 | 10.24% | |
| FTSE 100 | 4.61% | |
| Nasdaq com | 2.44% | |
| SP500 | 2.10% | |
| Dax | 0.62% | |
| Hang Seng | -5.38% |
Summary
✅ Overall, the performance analysis over the three periods illustrates diverse regional trends. While Europe and Japan demonstrate strong recoveries and potential market leadership, persistent declines in key Asian and US indices may indicate underlying vulnerabilities. Portfolio diversification remains crucial, with careful attention to both geopolitical and economic developments influencing these regions.
Smart Data Insight
Master the Perfect Entry & Exit for this Stock
Don't leave your profits to chance. Historically, this stock follows specific seasonal patterns that institutional traders use to maximize returns.
- ✅ Identify the "Golden Buying Window"
- ✅ Avoid high-risk correction cycles
- ✅ Backtested data from the last 20+ years