
July 19, 2025 a 08:15 am

MU: Trend and Support & Resistance Analysis - Micron Technology, Inc.
Micron Technology, Inc., engaged in memory and storage products, has shown notable price movements recently. As the company continues to expand its footprint in the memory and storage sectors, analyzing the stock's technical trends is crucial. The recent data indicates fluctuations, with potential opportunities for traders and investors depending on the observed support and resistance levels. Observing these levels could offer insights into potential entry or exit points for market participants.
Trend Analysis
The trend analysis based on recent daily closing prices can offer insights into the stock's current momentum.
| Date | Close Price | Trend Indicator |
|---|---|---|
| 2025-07-18 | $114.39 | ▼ |
| 2025-07-17 | $113.26 | ▼ |
| 2025-07-16 | $116.43 | ▼ |
| 2025-07-15 | $120.11 | ▲ |
| 2025-07-14 | $118.61 | ▲ |
| 2025-07-11 | $124.53 | ▲ |
| 2025-07-10 | $123.11 | ▲ |
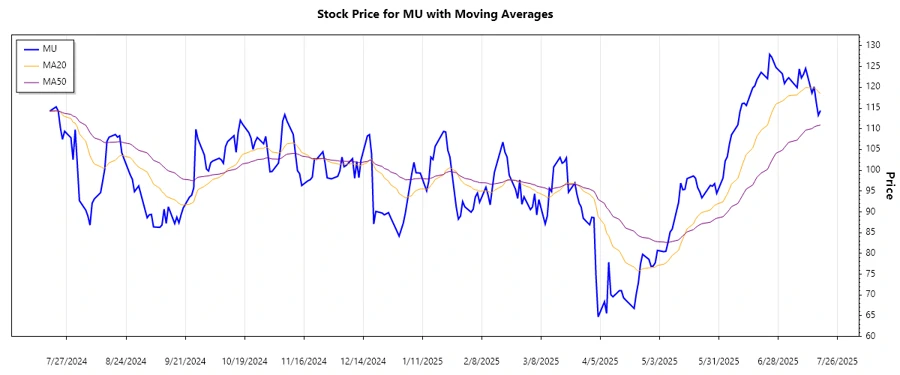
EMAs indicate a near-term upward momentum as EMA20 is slightly above EMA50, suggesting a short-term bullish sentiment. This may encourage buying interest among traders.
Support- and Resistance
An analysis of support and resistance zones can help determine critical price levels.
| Type | Zone |
|---|---|
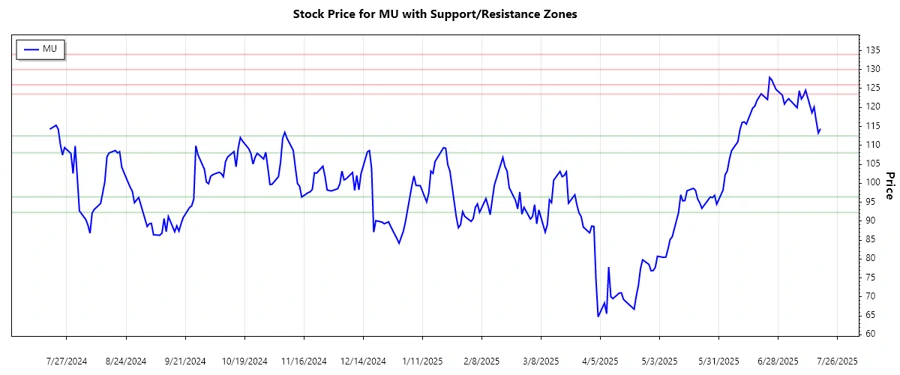
| Support | 92.30 - 96.40 ▲ |
| Support | 108.00 - 112.50 ▲ |
| Resistance | 123.50 - 126.00 ▼ |
| Resistance | 130.00 - 134.00 ▼ |
The current price is nestled between the first resistance zone, suggesting possible consolidation or a move towards breaking through the upper resistance area.
Conclusion
The stock analysis for Micron Technology, Inc. reveals a general short-term upward trend based on moving averages, although recent sessions show mixed momentum. While the bullish sentiment offers potential gains, investors should be cautious of the resistance zone, which could reverse future gains. Thus, any upward momentum beyond resistance should be closely monitored for further breakout confirmations. Careful attention to support zones could also guide investors in minimizing potential risk. The market remains dynamic, and diversifying investments while staying updated with both technical and fundamental indicators is advisable.
Smart Data Insight
Master the Perfect Entry & Exit for this Stock
Don't leave your profits to chance. Historically, this stock follows specific seasonal patterns that institutional traders use to maximize returns.
- ✅ Identify the "Golden Buying Window"
- ✅ Avoid high-risk correction cycles
- ✅ Backtested data from the last 20+ years