March 21, 2026 a 11:44 am
MU: Fibonacci Analysis - Micron Technology, Inc.
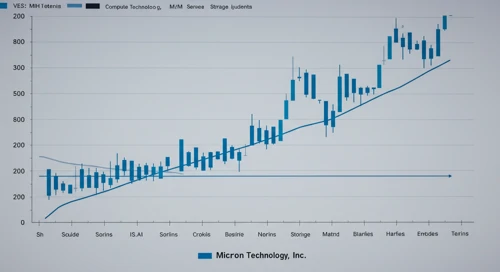
Micron Technology, Inc., a leader in the semiconductor industry, has shown a significant bullish trend over the past months. This upward trajectory is likely fueled by increased demand for memory and storage solutions across various sectors. As the company continues to innovate within its segments, investor confidence remains high, suggesting potential for further appreciation in stock value.
Fibonacci Analysis
| Details | Information |
|---|---|
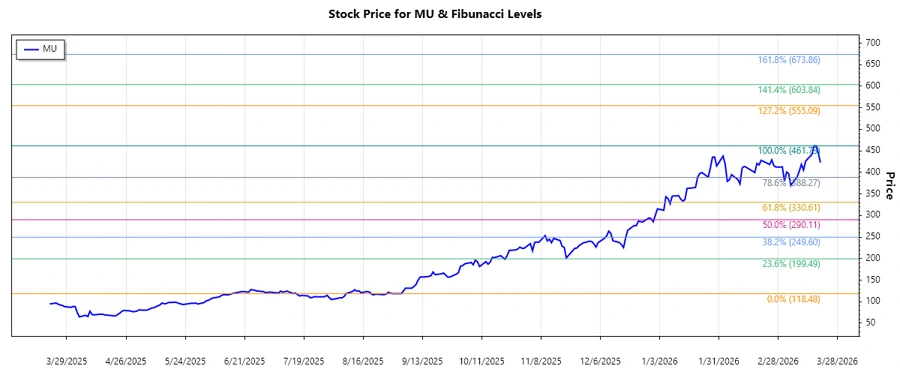
| Trend Start Date | 2025-09-03 |
| Trend End Date | 2026-03-18 |
| High Point (Date) | 461.73 (2026-03-18) |
| Low Point (Date) | 118.48 (2025-09-02) |
| Fibonacci Levels |
|
| Current Retracement Zone | none |
| Technical Interpretation | The stock price is currently resting above the critical levels, suggesting that the recent price action may be an indication of further bullish momentum. Currently, no major retracement levels have been tested. |
Conclusion
The recent analysis of Micron Technology indicates a robust upward trend, with the current price maintaining above significant Fibonacci retracement levels. Such an alignment often anticipates continued growth, presenting opportunities for bullish investors. However, the company's performance remains sensitive to market shifts in technology demand, geopolitical influences, and macroeconomic factors. As such, while prospects appear strong, careful monitoring of industry trends is advised to gauge potential risks effectively.