August 07, 2025 a 03:15 pm
MU: Fibonacci Analysis - Micron Technology, Inc.
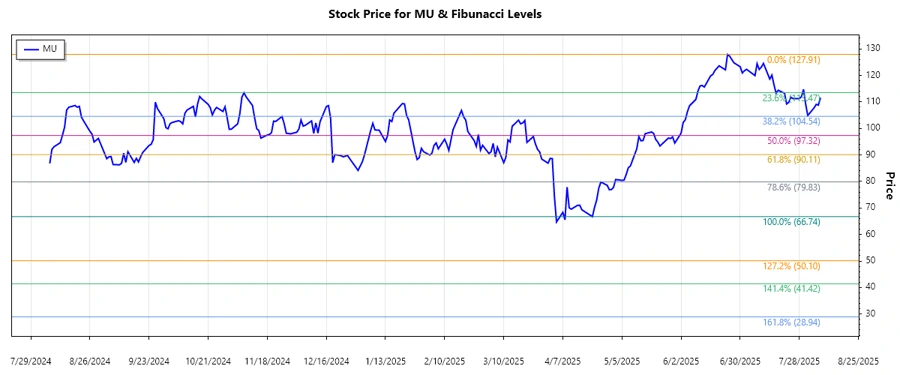
Micron Technology, Inc. has experienced significant fluctuations in its stock price over the analyzed period, with a dominant downward trend seen in recent months. This trend can be attributed to various factors, including industry cycles and global economic conditions. The Fibonacci analysis may help in identifying critical price levels for potential support or resistance as the market reacts to broader developments.
Fibonacci Analysis
| Analysis Details | Value |
|---|---|
| Start Date | 2024-08-07 |
| End Date | 2025-08-07 |
| High Price | $127.91 (2025-06-24) |
| Low Price | $66.74 (2025-04-21) |
Fibonacci Retracement Levels
| Level | Price |
|---|---|
| 0.236 | $84.89 |
| 0.382 | $92.90 |
| 0.5 | $97.33 |
| 0.618 | $101.76 |
| 0.786 | $108.34 |
The current price of $111.57 is above the 0.786 Fibonacci retracement level, suggesting the trend is moving beyond potential resistance. This predominantly indicates a possible continuation of the upward momentum, but caution is advised as corrective movements could also occur.
Conclusion
Micron Technology's stock shows resilience despite recent bearish trends, and the Fibonacci retracement analysis highlights potential support and resistance levels. As the stock currently trades above the critical 0.786 level, it may see further upward momentum unless met by strong external factors or resistance. Investors should remain vigilant for signs of market correction, yet the possibility of capturing further gains persists if the upward trend consolidates. Overall, while opportunities are present, the volatility of the semiconductor market must be considered in investment decisions.
Smart Data Insight
Master the Perfect Entry & Exit for this Stock
Don't leave your profits to chance. Historically, this stock follows specific seasonal patterns that institutional traders use to maximize returns.
- ✅ Identify the "Golden Buying Window"
- ✅ Avoid high-risk correction cycles
- ✅ Backtested data from the last 20+ years